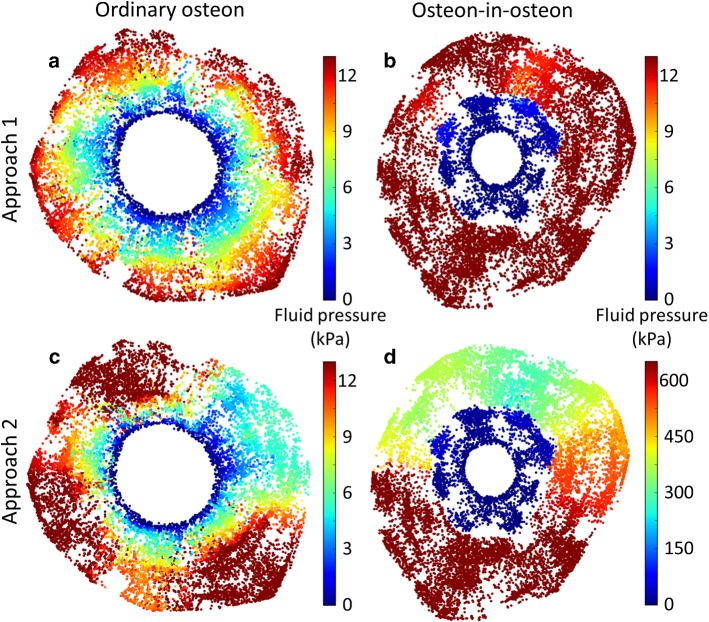
Fig. 3.
Pressure pattern images were made by plotting color-coded spheres at the location of each node of the network for a representative ordinary osteon (left) and osteon-in-osteon (right) (same osteons as in Fig. 2). The fluid flow was modeled with two approaches. Approach 1) A pressure difference of 13 kPa between cement line and Haversian canal was applied to an ordinary osteon (a) and an osteon-in-osteon (b). Approach 2) Fluid flow was forced out of the ordinary osteon (c) and osteon-in-osteon (d) as water is squeezed out of a steadily compressed sponge (i.e., constant homogeneous strain rate). The difference in pressure patterns between the two osteon types is a direct result of a difference in LCN topology. The much higher pressure in d) (note the different color scale) is partly caused by the much lower permeability of this osteon-in-osteon

