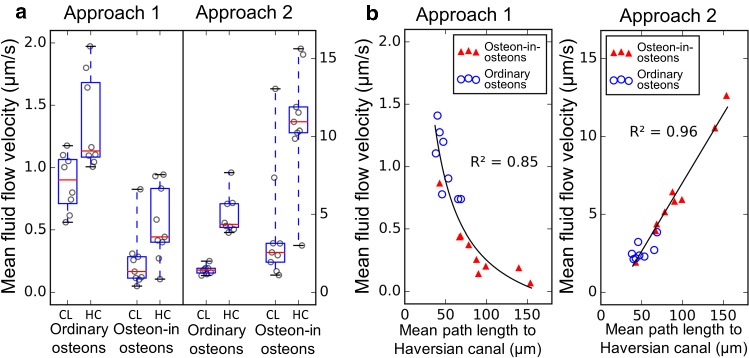
Fig. 6.
Comparison of average fluid flow velocities. Each data point in the plots represents one osteon. a Comparison between fluid flow velocity in the outer half (CL for half close to cement line) and the inner half (HC for half close to Haversian canal) of the ordinary osteons. The box extends from the first to third quartile, the red line shows the median, and the whiskers extend from the box to show the full range of the data. b Relationship between average fluid flow velocity and mean path length to the Haversian canal. Different models were used to fit the data (black lines). For approach 1 the average fluid flow velocity is inversely related with the average shortest path length. For approach 2 the fluid flow velocity is linearly related with average shortest path length

