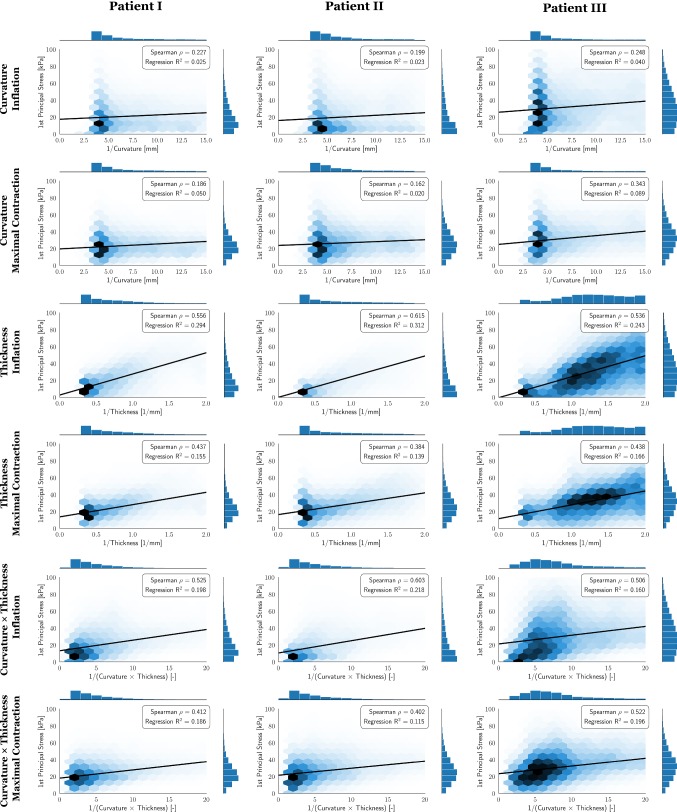
Fig. 6.
Hexbin plots of (i) total stress () vs. the inverse of curvature, (ii) total stress versus the inverse of thickness and (iii) total stress versus the inverse of (curvature thickness) for the inflated and the maximal contracted state, respectively. Thickness, curvature and the first principal stress were interpolated on the nodes of the finite element mesh and analyzed. Regions close to the pulmonary vein inlets and the mitral valve were excluded from the statistical analysis and the plots since data there may be affected by the spring-type boundary conditions. Black lines show a linear regression model fit. Spearman’s values and values from the linear regression fit are given for each plot

