
Fig. 7.
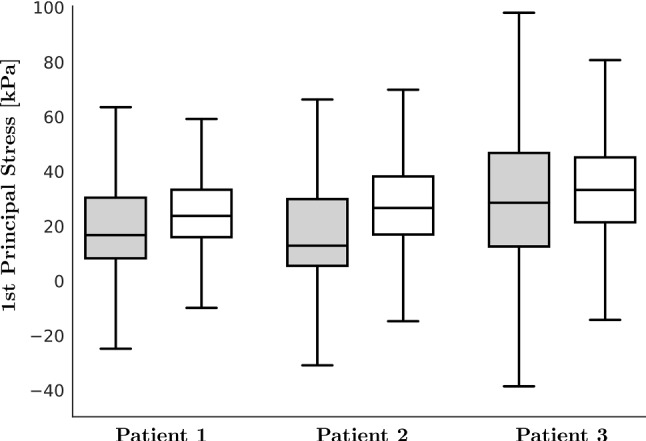
Statistical distribution of stress for all three patient cases. Boxplots show the distribution of the 1st principal Cauchy stress: in gray stresses at inflated (), in white stresses at contracted state (). The box represents the interquartile range (IQR) between lower quartile (25 %) and upper quartile (75 %); horizontal black line represents the median value; whisker ends represent the lowest and highest data points still within 1.5 IQR of the lower and upper quartiles, respectively