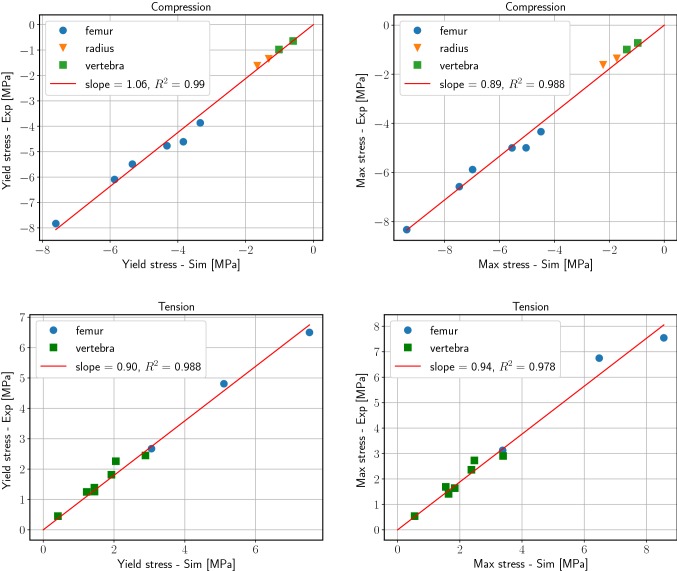
Fig. 3.
Linear regression analysis for compression (top) and tension (bottom): the apparent 0.2% yield stress (left) and maximum stress (right) obtained in the simulations (on the x-axis) are compared to the experimental values (on the y-axis, from Schwiedrzik et al. (2016))

