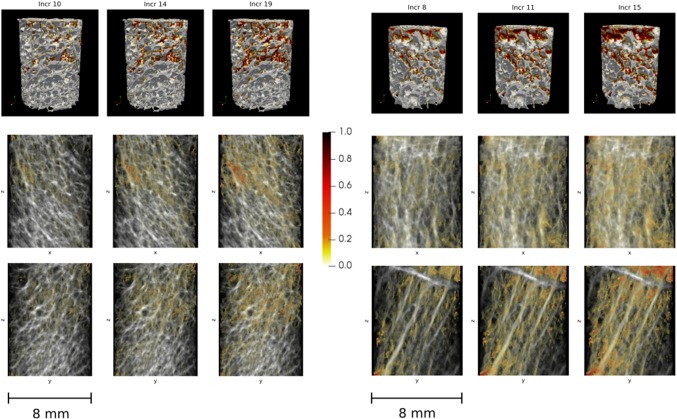
Fig. 5.
Development of local damage regions over the simulation (pseudo-) time. One sample under compression (left) and one under tension (right) are shown. The first columns give the local damage at the apparent 0.2% yield point and the third columns at the maximum point. The structures are shown in 3D (top row) and in two perpendicular projections (middle and bottom row). The bone structure is depicted in grayscales, the damage D in red

