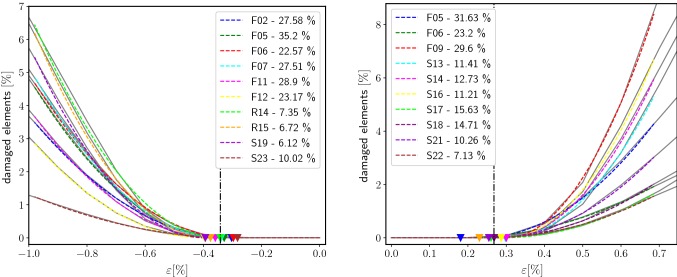
Fig. 6.
The percentage of elements that are damaged () shows a sudden increase in the inelastic start point . The colored triangles denote of the individual samples and the dotted line marks the average . The inelastic region starts later for compression (left) than for tension boundary conditions (right)

