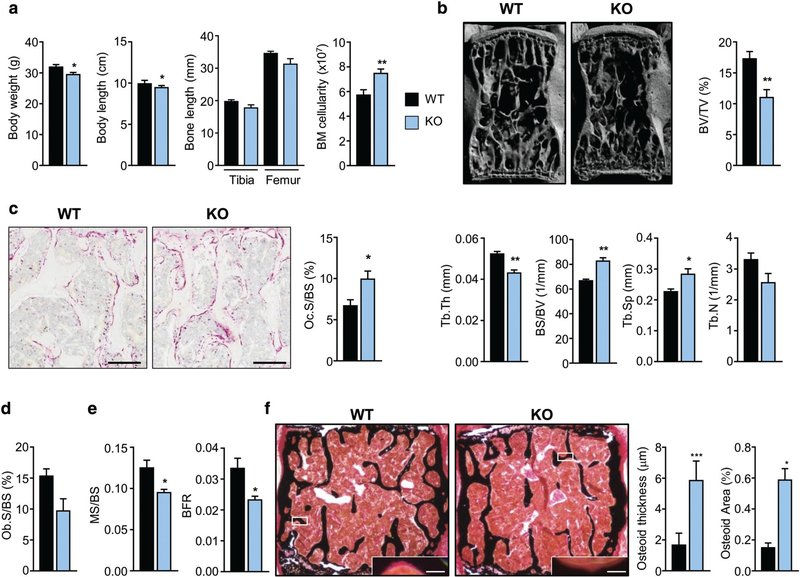
Fig. 3.
The Dpp3 KO mouse model displays a bone loss phenotype. (A) Body weight, body length, long-bone length, and BM cellularity from one femur and one tibia per mouse, in WT and Dpp3 KO mice. (B) μCT analysis of lumbar vertebrae: 3D reconstruction and static histomorphometric analysis of trabecular bone in WT and Dpp3 KO mice. (C) Representative images of decalcified paraffin-embedded TRAP-stained sections of WT and Dpp3 KO bone, and quantification of Oc.S/BS. Scale bar = 200 μm. (D) Ob.S/BS ratio, as assessed through ALP-staining of WT and Dpp3 KO lumbar vertebrae. (E) Dynamic histomorphometric analysis. (F) Representative images of mineralized resin-embedded von Kossa-stained vertebrae of WT and Dpp3 KO mice, and corresponding quantization of osteoid thickness and area. Scale bar = 150 μm and 5 μm, for the lower magnification and the inset, respectively. All the evaluations were performed in 6-month-old male mice. For each evaluation, n ≥ 6 per genotype. *p < .05, **p < .01, ***p < .001. BM = bone marrow; 3D = three-dimensional; Oc.S/BS = osteoclast surface/bone surface; Ob.S/BS = osteoblast surface/bone surface.

