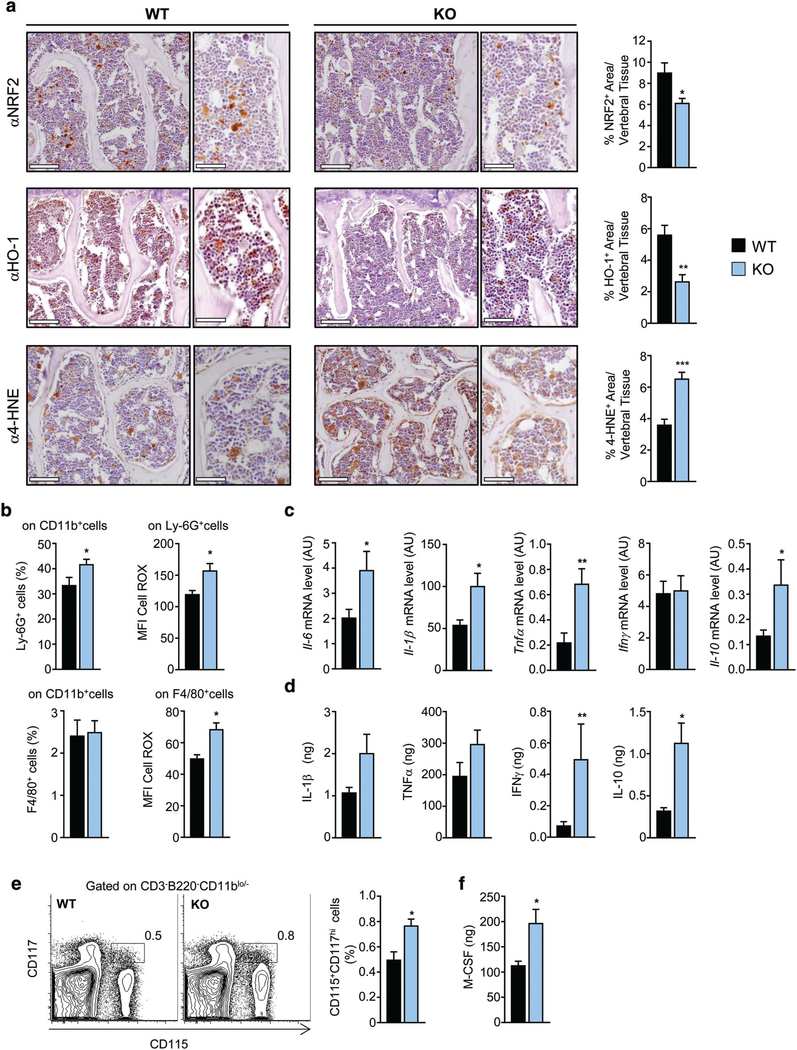
Fig. 5.
Absence of DPP3 leads to increased oxidative stress and inflammation in the bone tissue. (A) Representative images, and corresponding high magnification, of sections of decalcified paraffin-embedded vertebrae of WT and Dpp3 KO stained with antibodies against Nrf2, HO-1, and 4-HNE, and corresponding quantization. Scale bar = 100 μm for lower magnification, and 50 μm for higher magnification images. (B) Upper panels: frequency of PMNs (as percentage of Ly-6G+ after gating on CD11b+ cells) and corresponding amount of ROS production as MFI in the BM of WT and Dpp3 KO mice. Lower panels: frequency of macrophages (as percentage of F4/80+ after gating on CD11b+ cells) and corresponding amount of ROS production as MFI, in the BM of WT and Dpp3 KO mice. (C) qPCR of genes coding for inflammatory cytokines in the BM cells of WT and Dpp3 KO mice. (D)Quantification of amount of inflammatory cytokines in the BM supernatant of WT and Dpp3 KO mice. (E) Representative plot of FACS analysis of CD115+CD117hi cells in WT and Dpp3 KO BM, and corresponding quantification. (F) Quantification of M-CSF amount in the BM supernatant of WT and Dpp3 KO mice. For each evaluation, n ≥ 6 per genotype. *p < .05, **p < .01. PMN = polymorphonuclear cell; MFI = meanfluorescence intensity.

