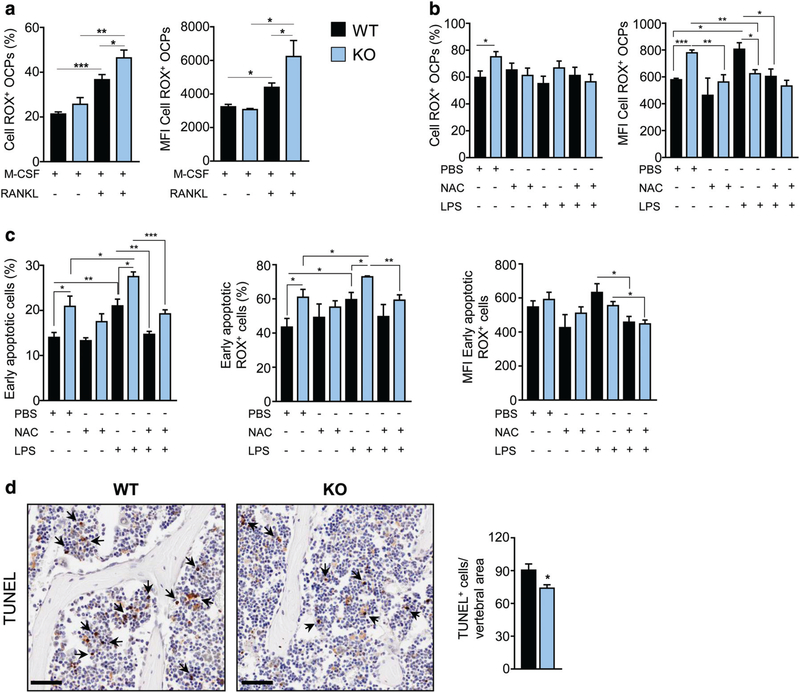
Fig. 7.
Dpp3 KO osteoclast precursor cells display higher ROS production and proneness to apoptosis. (A, B) Percentage of ROS+ WT and Dpp3 KO OCPs and amount of ROS production expressed as MFI of ROS+ OCPs, as assessed by FACS analysis in the presence of the indicated stimuli. (C) Percentage of WT and Dpp3 KO early apoptotic cells and measurements of ROS production in this cell population, assessed as in A and B. (D) Representative images of PFA-fixed paraffin-embedded bone of WT and Dpp3 KO mice stained with TUNEL, and corresponding quantification. Scale bar = 50 μm. Arrows indicate representative positive cells. For each evaluation, n ≥ 4 per genotype per group. *p < .05, **p < .01, ***p < .001. OPC = osteoclast precursor cell; MFI = mean fluorescence intensity.

