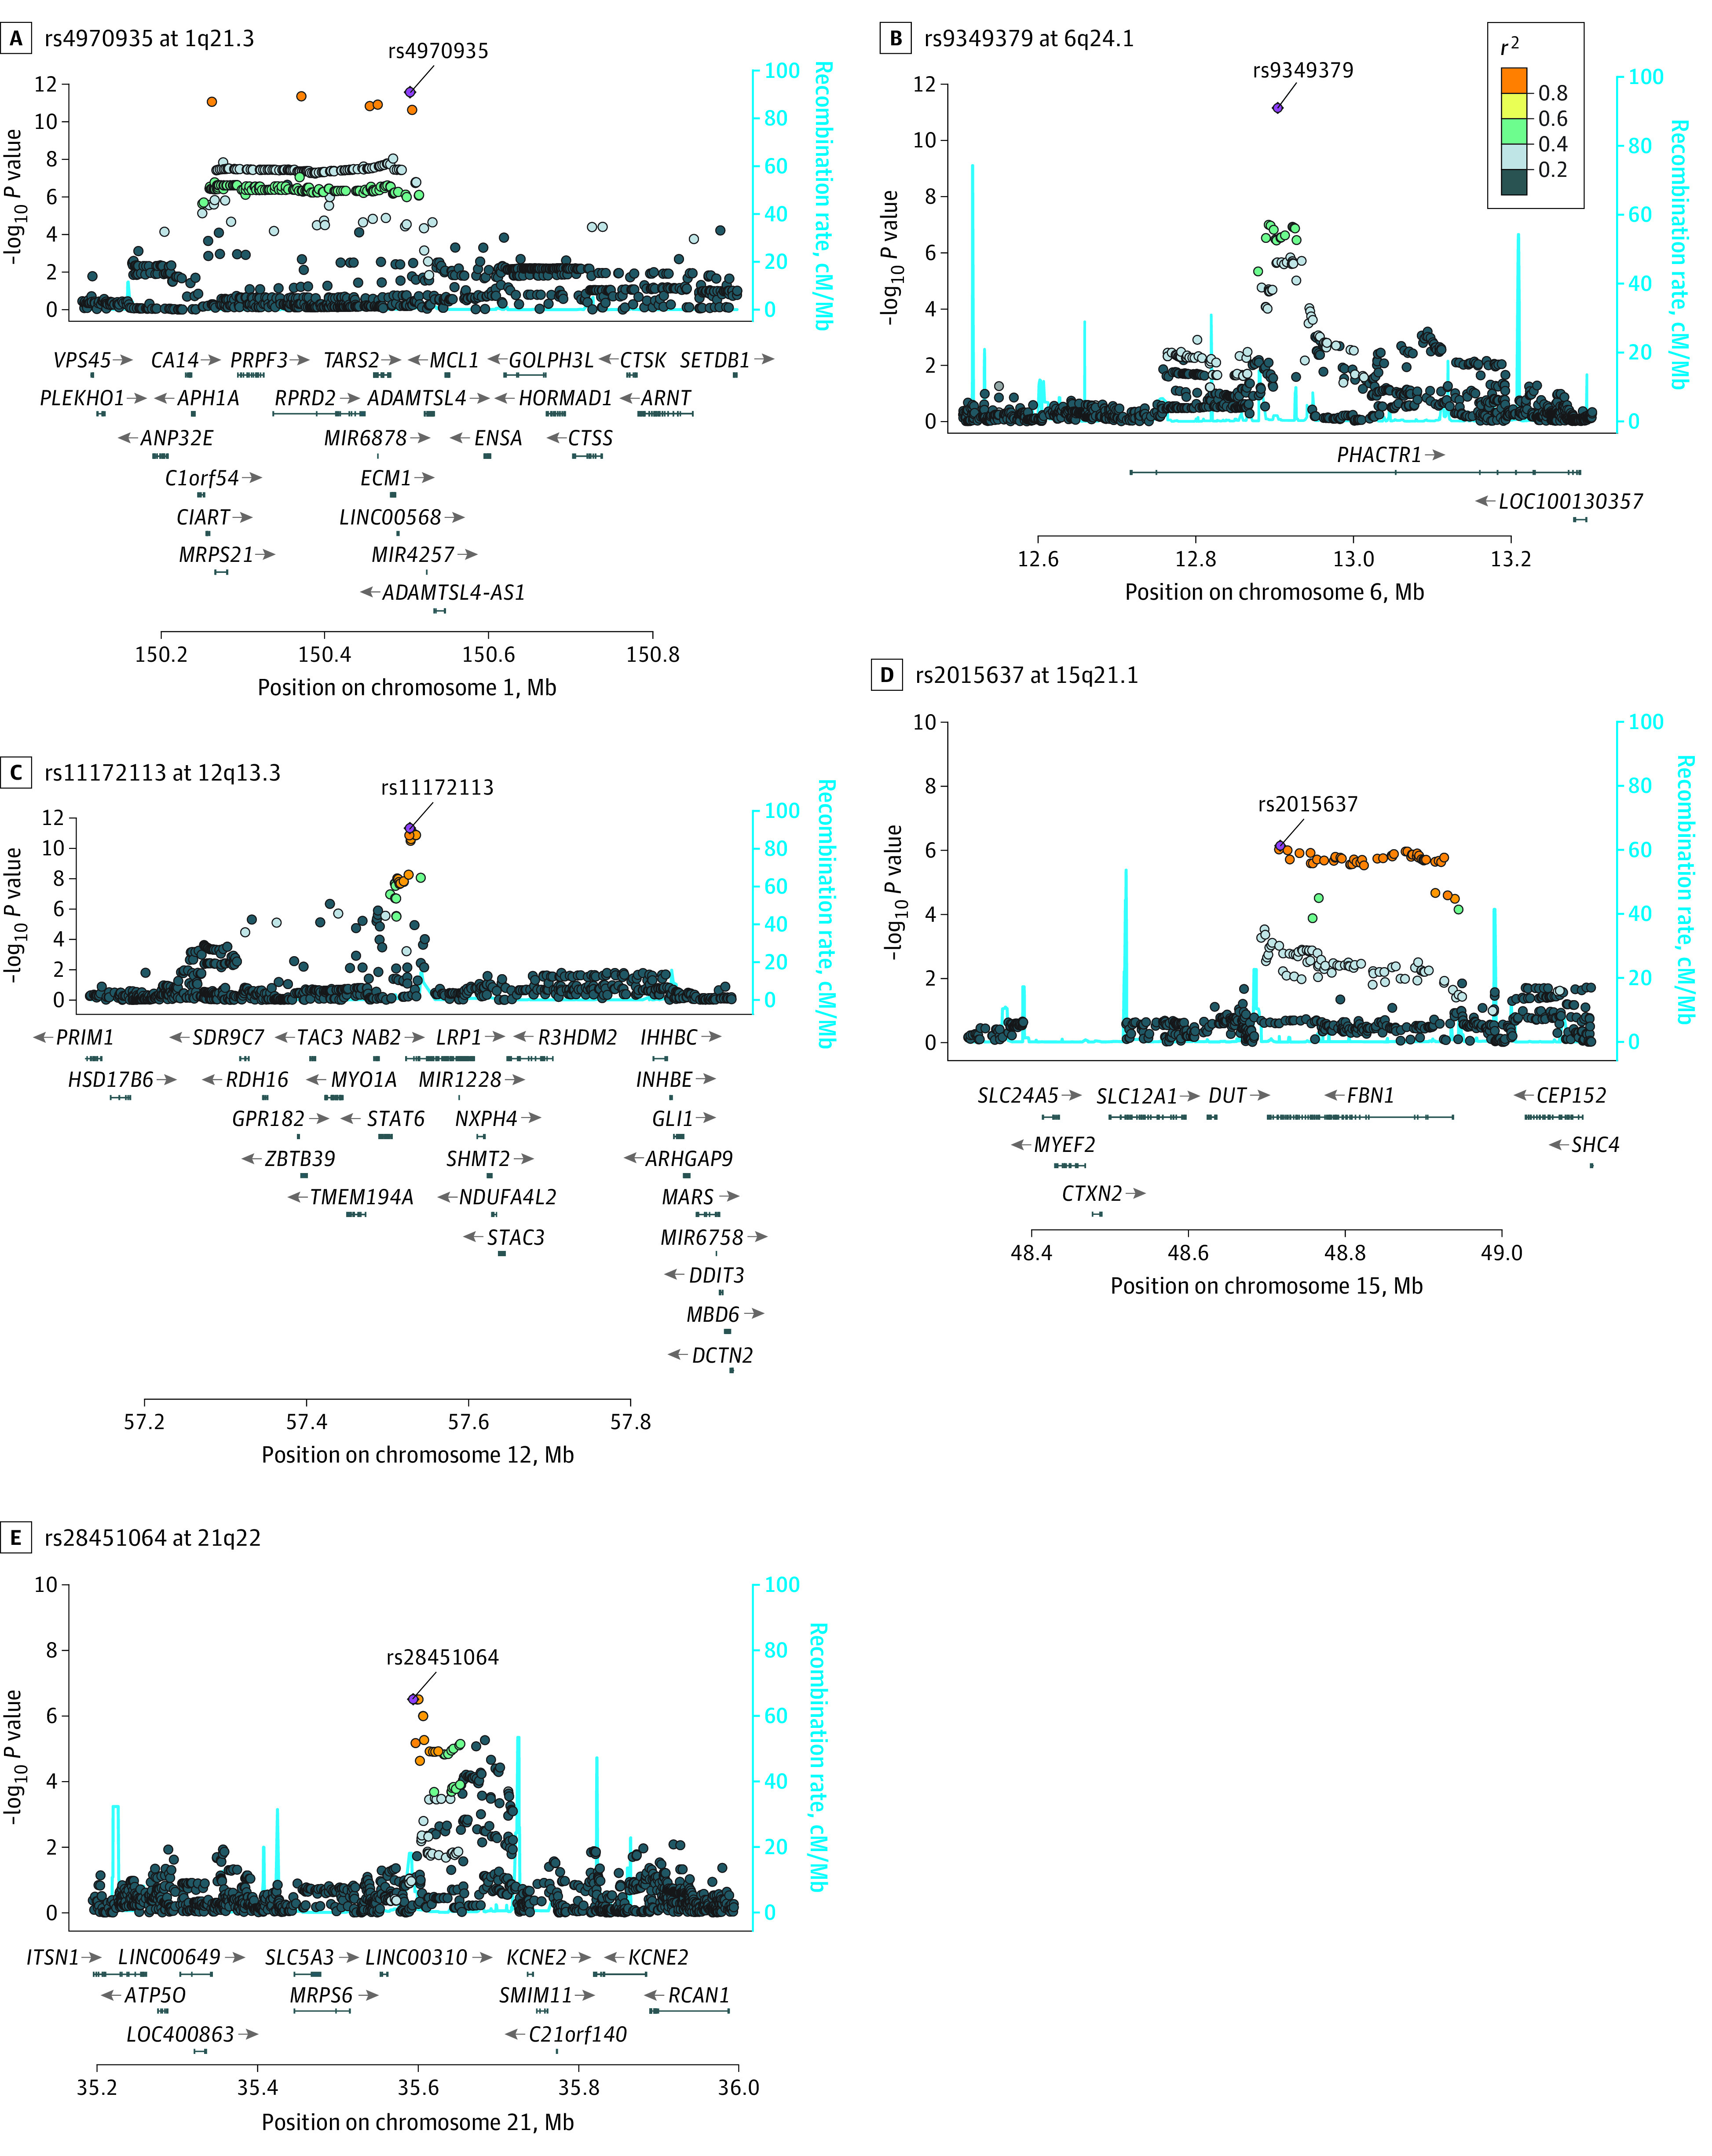
Figure 2. Regional LocusZoom Plots Demonstrating Positional Candidate Genes.

LocusZoom plots for rs4970935 at 1q21.3 (A), rs9349379 at 6p24.1 (B), rs11172113 at 12q13.3 (C), rs2015637 at 15q21.1 (D), and rs28451064 at 21q22 (E). The x-axis indicates chromosomal position and the y-axis the association significance (–log10 [P value]) for the 400 kilobase flanking the index SNP. Linkage disequilibrium estimates (r2) are color-coded. Recombination hotspots are indicated by blue lines.
