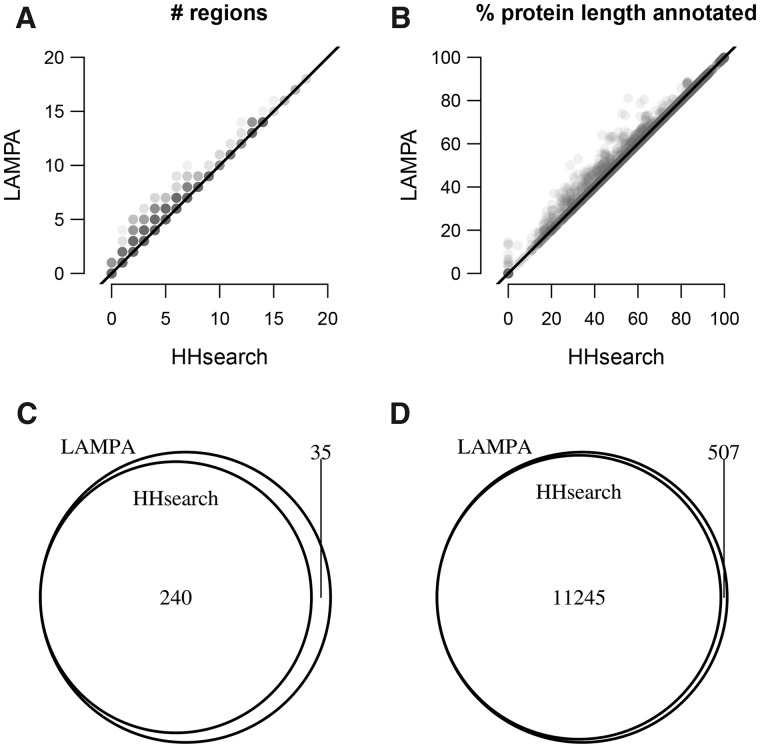
Fig. 3.
Gain of homology recognition by LAMPA compared to HHsearch. Presented are four depictions of results of querying pfamA_31.0 with 2985 RNA virus proteins using LAMPA and HHsearch. (A) Number of regions (hit clusters) per query protein annotated by the two tools. Each protein is depicted by a transparent gray dot. Since multiple proteins may have the same or similar number of regions annotated by the two tools (x and y dot coordinates), dots may overlap. Gray density is proportional to the number of overlapping dots. Black line, diagonal. (B) Share of protein length (%) annotated by the two tools. For other details, see panel A. (C) Overlap between Pfam profiles that were linked to RNA virus proteins by the two tools. (D) Overlap between RNA virus polyprotein regions annotated by the two tools

