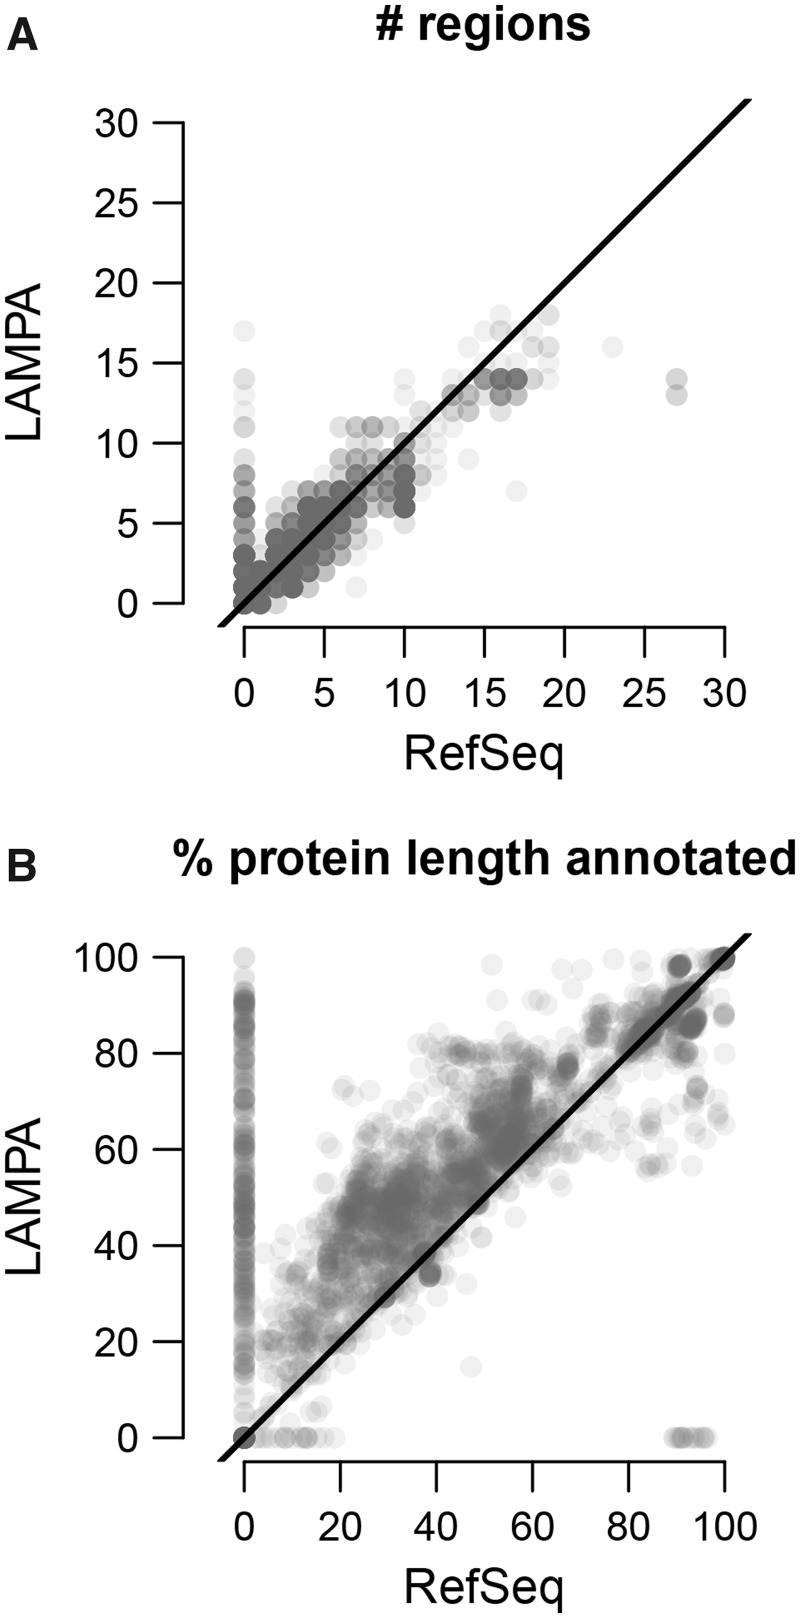
Fig. 8.
Summary statistic of annotation coverage by LAMPA and RefSeq experts. Comparison of the number of regions per protein (A) or percentage of protein length (protein coverage) (B) annotated by LAMPA (Stages #1–3) and RefSeq experts, based on analysis 2985 RNA virus proteins. Each protein is represented by a transparent gray dot; dot density is proportional to the number of proteins with identical characteristics. Black line, diagonal

