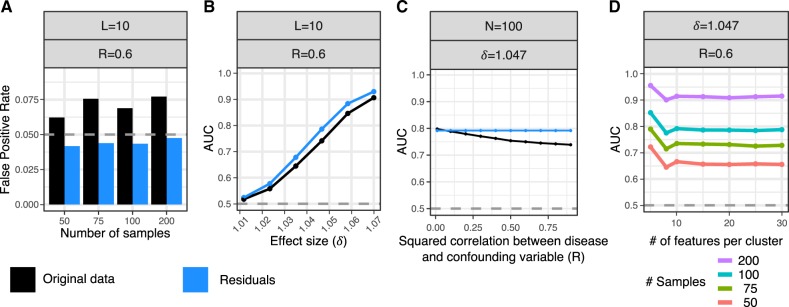
Fig. 3.
Evaluate false-positive rate and power from biologically realistic simulations. Simulate locally correlated epigenetic features of L features per cluster, N case and N control samples, a differential correlation effect size δ, and a confounding variable that has squared correlation with the disease status of R. Analysis was performed on either the original data (black) or the residuals after correcting for covariates (blue). The differential correlation test was performed with the Box.permute test on 3920 combinations of parameter values and a subset of summarized here. See Supplementary Material for details and additional simulation results. (A) False-positive rate under the null model of no differential correlation at P < 0.05 (gray dashed line) shown for analysis of the original data and residuals. (B) AUC over range of differential correlation effect sizes. Grey dashed line indicates AUC of a rand om classifier (C) AUC across a range of values for R. (D) AUC versus the number of features per clusters shown for multiple samples sizes. Note that 95% confidence intervals were computed for all AUC values, but they are too narrow to see here. (Color version of this figure is available at Bioinformatics online.)

