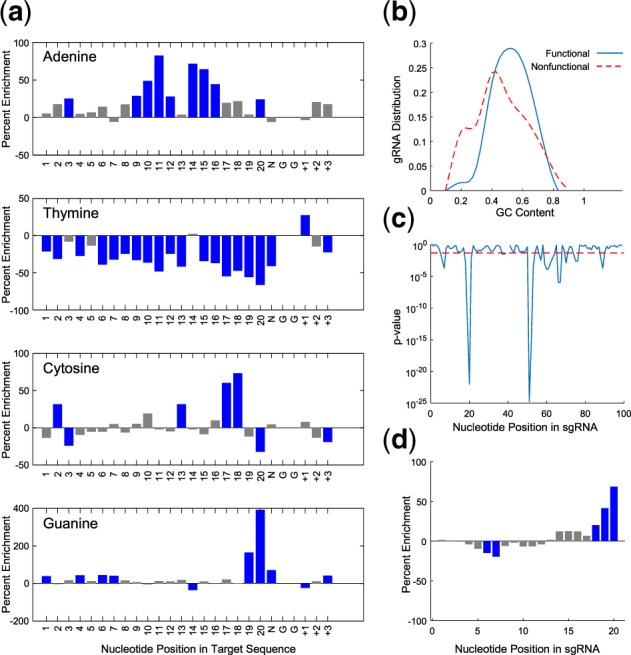
Fig. 2.

Feature analysis of efficient sgRNAs. (a) Position-specific nucleotide composition. A positive or negative value represents enrichment or depletion of the nucleotide, respectively. Statistically significant nucleotides are depicted in blue. (b) GC content of the gRNA. (c) Significance of nucleotide accessibility at each position in the sgRNA. The significance level (P = 0.05) is depicted with red dashes. (d) Percent enrichment of nucleotide accessibility at each position in the gRNA. Significant positions are depicted in blue. (Color version of this figure is available at Bioinformatics online.)
