
Fig. 10.
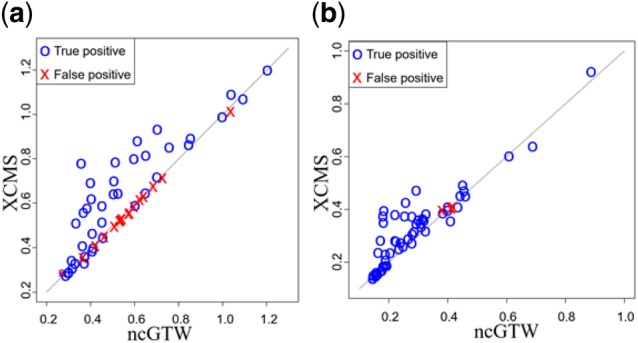
The comparisons of CV with versus without ncGTW realignment after the peak-filling step of XCMS. The blue circles represent the true positives and the red crosses represent the false positives. (a) The CV comparison on Rotterdam dataset. (b) The CV comparison on MESA dataset. (Color version of this figure is available at Bioinformatics online.)