
Fig. 2.
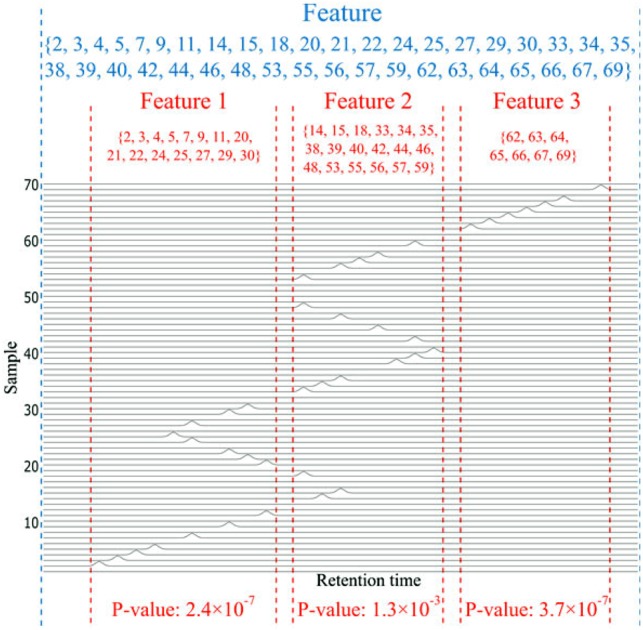
Illustrative example on detecting misaligned features. After initial alignment, among the total 70 samples, relevant peaks are detected only in some samples (the indices in blue), and some of the feature(s) are obviously misaligned. With a lower resolution grouping by XCMS, these peaks are all grouped into one single feature, as shown between the two blue dashed lines. While with higher resolution grouping, this feature is split into three features 1–3 as separated by the red dashed lines. The sample index sets of these features are shown in red, respectively. The P-values of features 1–3 are all smaller than 0.05, thus pass the first criterion. Because the sample index sets of these three features are also disjoint, they pass the second criterion. Accordingly, ncGTW will detect the misalignment and realign the whole blue feature produced by the lower resolution grouping. (Color version of this figure is available at Bioinformatics online.)