
Fig. 3.
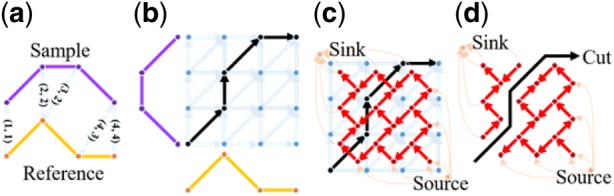
Principle concept of DTW grid and graph. (a) DTW alignment aims to find the pairs of corresponding points over which the maximum profile similarity is achieved. Here the paired corresponding points are (1, 1), (2, 2), (3, 2), (4, 3) and (4, 4) that form the warping function. (b) DTW grid for solving the warping function shown in blue edges and dots, where the cost of each edge is determined by the intensity distance of each point pair. By solving the ‘shortest path’ problem, the warping function is obtained (black path) whose paired corresponding points are reflected in (a). (c) Based on the duality property of planar graph, DTW gird is transformed to DTW graph (red and orange lines and dots), where each red or orange edge crosses one blue edge, and the cost of red or orange edge is the same as the cost of blue edge. Note that orange lines link only the vertices (red dots enclosed by blue lined exterior triangle) to a single source or sink. Then, the shortest path problem becomes a maximum-flow/minimum-cut problem. (d) Solving the alignment problem is to find a ‘cut’ which separates the DTW graph into two parts with the minimum cost, with one part including the source and the other including the sink. The cut with the minimum cost corresponds to the warping function (black path). (Color version of this figure is available at Bioinformatics online.)