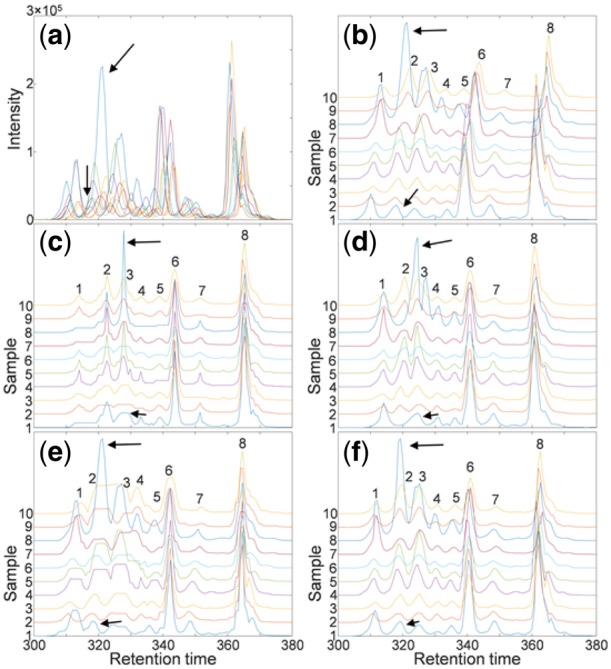
Fig. 8.

Illustrative realignment successfully performed by ncGTW incorporating ‘line’ structure in small-scale real LC-MS dataset. (a) LC-MS profiles of total ten samples. (b) The same LC-MS profiles but the curves are shifted to separate the curves. The 8 indexed peaks on sample 10 represent there are 8 peak groups. The peaks indicated by arrows in group 2 were misaligned by most peer methods except GTW and ncGTW. (c) The arrow-indicated peaks were wrongly aligned to the third peak group (and all peaks were severely distorted by DBA). (d) The arrow-indicated peaks were misaligned by CPM. (e) The arrow-indicated peaks were well-aligned by GTW while the fourth and fifth peak groups were misaligned. (f) All nine peak groups were correctly and accurately aligned by ncGTW in this challenging case
