
Fig. 4.
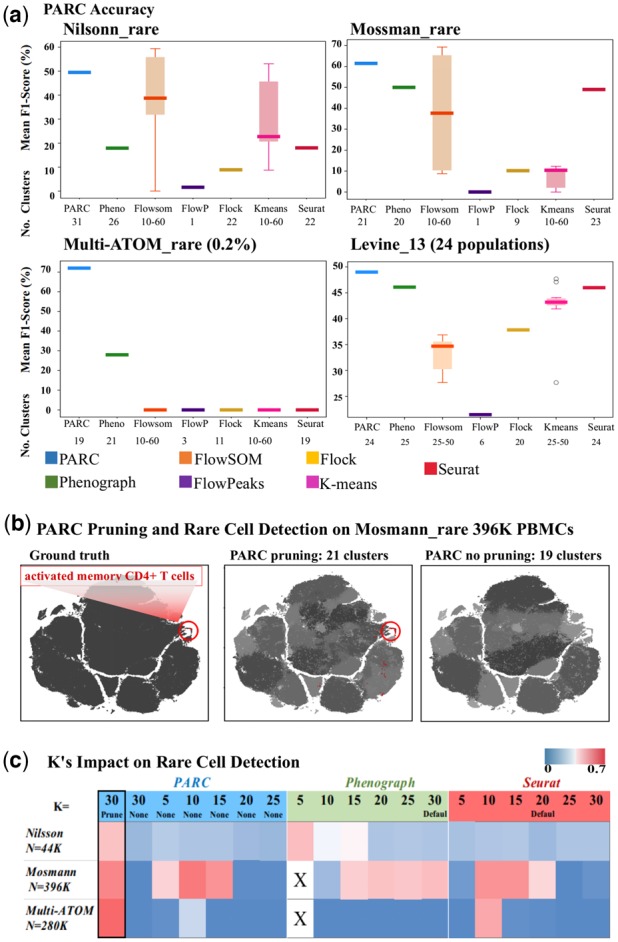
(a) Performance comparison of PARC on 1 multi-population (lower-right, Levine_13) and 3 rare-cell datasets against 6 competitive tools and their corresponding number of clusters. (b) Pruning in PARC enables rare population detection. (left) t-SNE plot colored by 'ground truth' of Mosmann_rare data. PBMCs and activated CD4+ T cells are labeled as black and red (encircled), respectively; (mid) colored by PARC with pruning, the cluster containing majority of rare activated memory T-cells is colored red and other clusters of PBMCs are in shades of grey; (right) colored by PARC without pruning - the rare activated memory T-cells (red) are not detected. (c) Comparison among PARC, Phenograph and Seurat in identifying the rare cell population in 3 datasets: Nilsson_rare, Mosmann_rare, multi-ATOM_rare, with rare populations of 0.08%, 0.03%, and 0.04%. This analysis signifies that simply lowering K in graph construction does not ensure rare-cell detection. X's denote stalled process due to lack of efficient fragmentation handling for low K.