
Fig. 5.
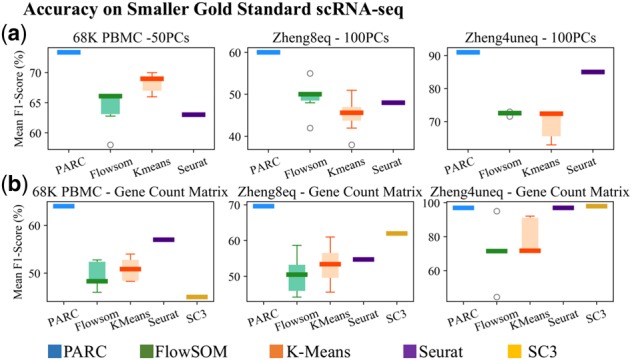
Performance of PARC on scRNA-seq datasets compared to other methods. (a) F1-scores on principal components (PCs) of top 10% highly variable genes (HVG); (b) F1-scores when input is the count matrix of top 10% HVG or 1000 HVG for 68K PBMC shows PARC maintains a high level of accuracy relative to other methods on both types of inputs