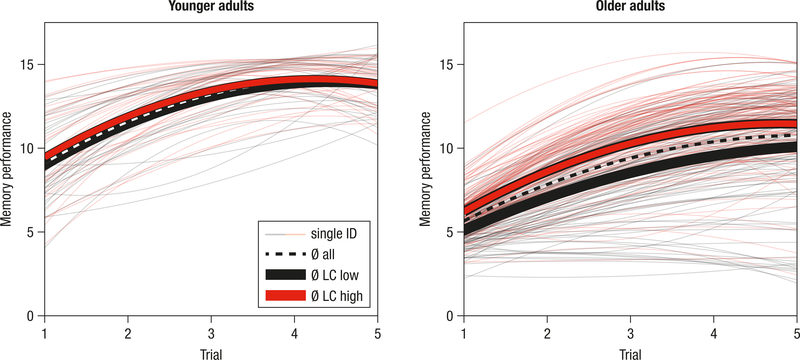
Figure 4.
Estimated learning and memory performance trajectories for younger (left panel; n = 66) and older adults (right panel; n = 228). For visualization of the association between locus coeruleus (LC) integrity and memory performance, single subjects (thin lines) are color-coded based on LC integrity (median-split) and mean trajectories for subgroups are displayed (n = 33 younger adults are in the low and high LC group; n = 114 older adults are in the low and high LC group, respectively).

