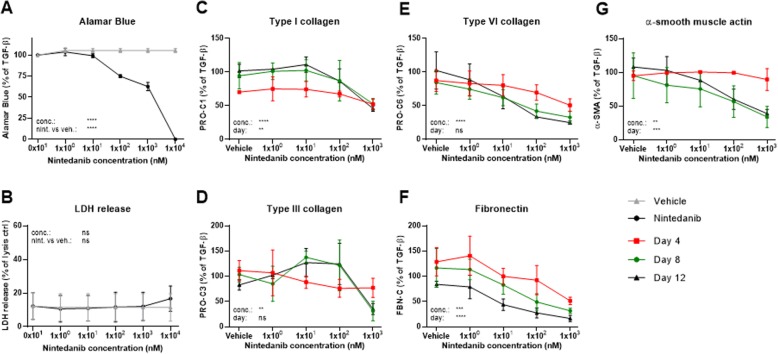
Fig. 5.
Nintedanib reduced fibrogenesis and effects were more evident at later timepoints. Lung fibroblasts were stimulated with TGF-β1 and treated with 1 × 100, 1 × 101, 1 × 10², 1 × 10³ or 1 × 10⁴ nM nintedanib or vehicle (0.1% DMSO). a Metabolic activity was assessed by Alamar Blue at day 12 and data are presented as percentages of the TGF-β1 control for vehicle and nintedanib. b Cytotoxicity was assessed by lactate dehydrogenase (LDH) release at day 4 and data are presented as percentage of the maximum LDH release determined by cell lysis for vehicle and nintedanib. c-g Biomarkers of ECM synthesis (type I (PRO-C1), III (PRO-C3) and VI (PRO-C6) collagen and fibronectin (FBN-C)) and fibroblast activation (α-SMA) were measured in the supernatant at day 4, 8 and 12. Data are not shown for the highest concentration of nintedanib which significantly reduced Alamar Blue. Data are presented as percentage of the TGF-β1 control for day 4, 8, and 12. All data are shown as mean ± SD of 3 separate experiments each with 4 replicates/treatment and analyzed by two-way ANOVA with Sidak’s or Dunnett’s multiple comparisons test comparing nintedanib to vehicle. ns non-significant; *P < 0.05; **P < 0.01; ***P < 0.001; ****P < 0.0001

