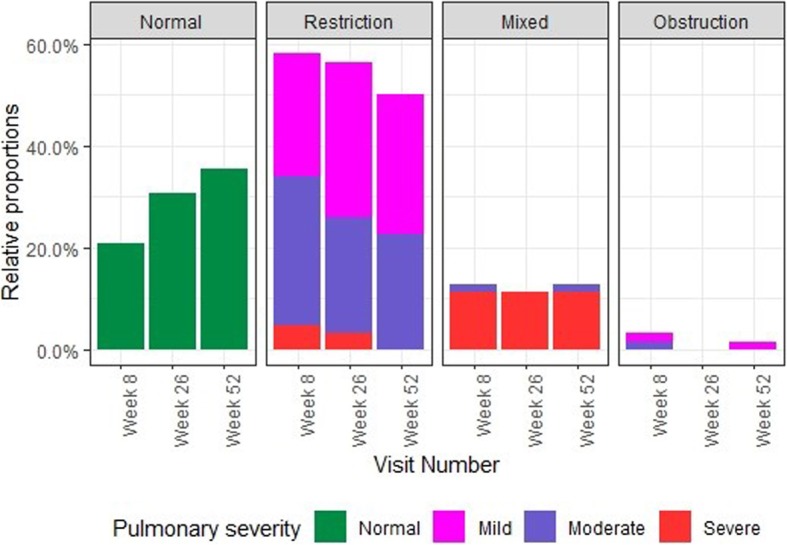
Fig. 3.

Proportions of types and severity grades of LI at different study visits. Week 8: N = 62, normal: 13 (20.97%), mild restriction: 15 (24.19%), mild obstruction: 1 (1.61%), moderate restriction: 18 (29.03%), moderate obstruction: 1 (1.61%), moderate mixed: 1 (1.61%), severe restriction: 3 (4.84%), severe mixed: 7 (11.29%), missing data: 3 (4.84%). Week 26: N = 62, normal: 19 (30.65%), mild restriction: 19 (30.65%), moderate restriction: 14 (22.58%), severe restriction: 2 (3.23%), severe mixed: 7 (11.29%), missing data: 1 (1.61%). Week 52: N = 62, normal: 22 (35.48%), mild restriction: 17 (27.42%), mild obstruction: 1 (1.61%), moderate restriction: 14 (22.58%), moderate mixed: 1 (1.61%), severe mixed: 7 (11.29%)
