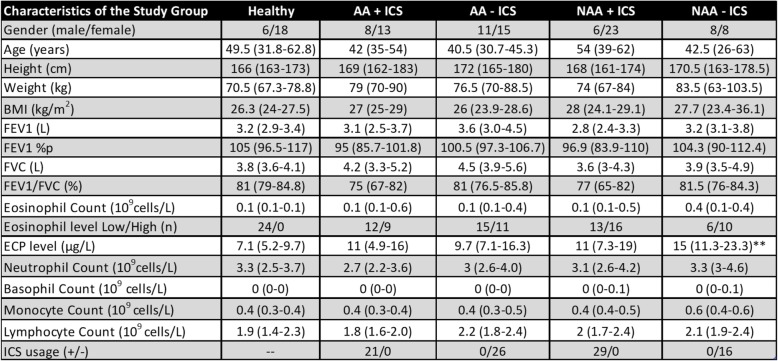
Table 1.
Characteristics of the study group divided based on circulating eosinophil levels
Data is presented as median with 25–75% in parenthesis. * = versus Healthy; # = versus AA Eos high; § = versus NAA Eos high. p < 0.05 *, p < 0.01 **, p < 0.001 = ***; p < 0.0001 = ****. Eosinophil data is shown as median of total subjects with the range divided into Low (LE) and High (HE) groups and number of subjects in each low/high group are given. AA Allergic Asthma. NAA Non-allergic asthma. %p percent predicted. FEV1 Forced Expiratory Volume in 1 s. FVC Forced Vital Capacity, BMI Body Mass Index, ICS Inhaled Corticosteroids

