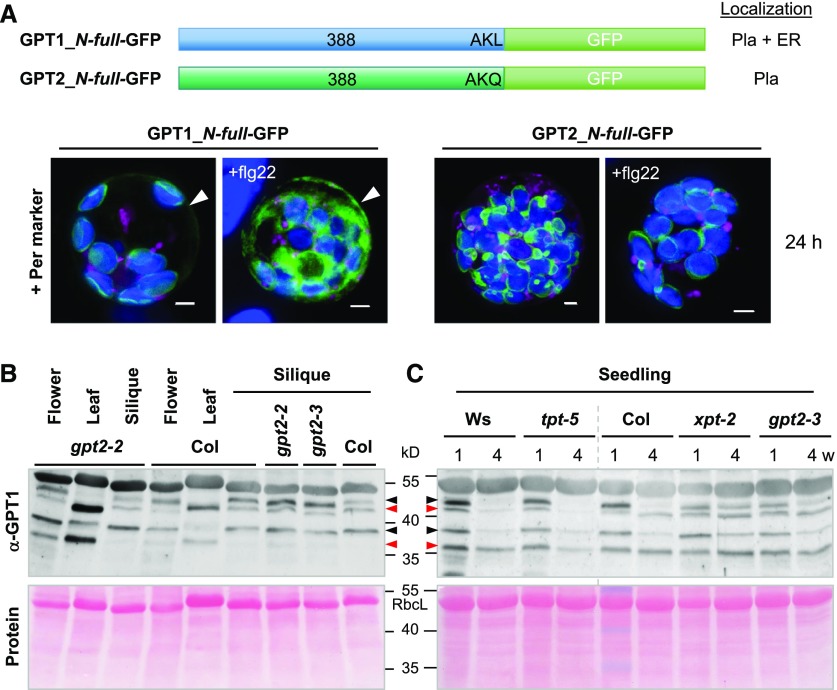
Figure 7.
GPT1 Levels at the ER Increased in Response to Stress Treatment and in Reproductive Arabidopsis Tissues.
(A) Arabidopsis protoplasts were co-transfected with the indicated GPT-GFP fusions and the peroxisome marker (Per, OFP-PGL3_C-short); Pla, plastids. The samples were split in half: one was treated with 0.2 μM of flagellin peptide (+flg22) and the other mock-incubated for 24 h. Note that flg22 treatment did not change GPT localization to plastids, but it increased the amount of the ER fraction of GPT1-GFP (arrowheads). All images show maximal projections of ∼30 single sections (merged; for single-channel images, see Supplemental Figure 13). GFP fusions are shown in green, peroxisome marker in magenta, and chlorophyll fluorescence in blue. Co-localization of magenta and green or very close signals (<200 nm) appear white in the merge of all channels. Scale bars = 3 μm.
(B) and (C) Protein extracts (without detergent) of flower, leaf, and green silique tissue were prepared from wild-type plants (Col, Ws) and the indicated homozygous mutant lines. Supernatant fractions were separated on 10% SDS gels and blotted onto nitrocellulose. After Ponceau-S staining, the blots were developed with GPT1-specific antibodies (α-GPT1) raised against the N terminus with His-tag (Supplemental Figure 14). Arrowheads mark double bands of full-length GPT1 (predicted size: 42.3 kD) and mature GPT1 (∼37 to 39 kD, depending on TP processing). Red arrowheads point to bands thought to represent a largely off-situation and black arrowheads the corresponding on-situation at either location (as deduced from comparison of leaf to silique tissue), likely due to protein modification.
(C) Immunoblot of seedlings harvested from germination plates (1% Suc) after 1- or 4-week (w) growth in short-day regime. Included mutant alleles: gpt2-2 (GK-950D09, T-DNA intron 2/exon 3), gpt2-3 (GK-780F12, T-DNA in exon 4), tpt-5 (FLAG_124C02, T-DNA in exon 9), and xpt-2 (SAIL_378C01, single exon; Hilgers et al., 2018). Note that the band pattern differs in OPPP-relevant gpt2 and xpt transporter mutants compared with wild-type Col and tpt-5 (wild-type Ws corresponds to tpt-5, vertical gray dashed line). Ponceau S-stained blots (protein) are shown as a loading reference; RbcL, large subunit of RubisCO. Molecular masses are indicated in kD.

