Figure 4.
CPK1 Controls the Expression of ORE1 and of ORE1 Target Genes.
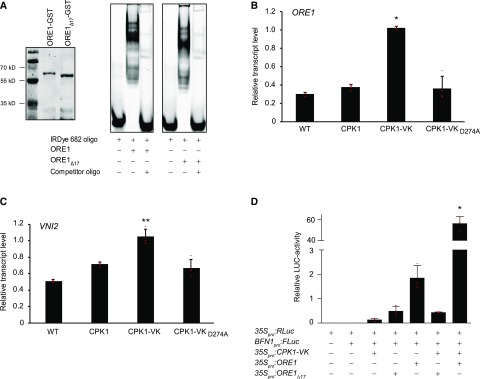
(A) Electrophoretic mobility shift assay. Recombinant ORE1-GST and ORE1Δ17-GST as in Figure 2C were affinity purified, expression was confirmed by immunoblot detection of ORE1-GST and ORE1Δ17-GST using the anti-GST-antibody (left) as described in “Methods.” Proteins were subjected to in vitro DNA binding assays using a labeled (5′-DY682) 40-bp region of the BFN1 promoter (right) in the absence or presence of a 200-fold excess of unlabeled oligomeric competitor fragment as indicated.
(B) and (C) RT-qPCR expression analysis, using the reference gene ACTIN2, of ORE1 (B) and ORE1-regulated target gene VNI2 (C) in wild-type and CPK1-expressing plants after a 10-h exposure to ethanol vapor. Relative transcript levels (= 2−ΔΔCt) are shown. Data show means and SDs of four biological replicates, each replicate consisting of cDNA from one individual Arabidopsis rosette. Individual 2−ΔΔCt values are depicted as small red horizontal lines. Asterisks denote statistically significant differences from the Col-0 wild type (WT; Kruskal-Wallis test and Dunn-Bonferoni post hoc test; *P < 0.05; **P < 0.005; Supplemental Data Set).
(D) ORE1-dependent BFN1-promoter activation is mediated by CPK1. Arabidopsis ore1-1 protoplasts were transfected with either 35Spro:RLuc (transfection control) or BFN1pro:FLuc (reporter) constructs in combination with the constitutively active kinase (35Spro:CPK1-VK) and either full-length (35Spro:ORE1) or mutated ORE1 transcription factor (35Spro:ORE1Δ17), which lacks 17 amino acids encompassing the CPK1-dependent phosphorylation sites. The relative luciferase (LUC) activity was determined as the ratio of the signals of target luciferase (FLUC) and control (RLUC), normalizing for transfection efficiency in different samples. Data show means of relative LUC activities of three biological replicates, with each replicate consisting of an independent transfection assay. Error bars represent the SDs. Individual values are depicted as small red horizontal lines. The asterisk denotes a statistically significant difference from all other coexpression combinations; one-way analysis of variance, Tukey post hoc test; *P < 0.05 (Supplemental Data Set).

