Figure 5.
Transcriptional Changes in chr4 Mutants.
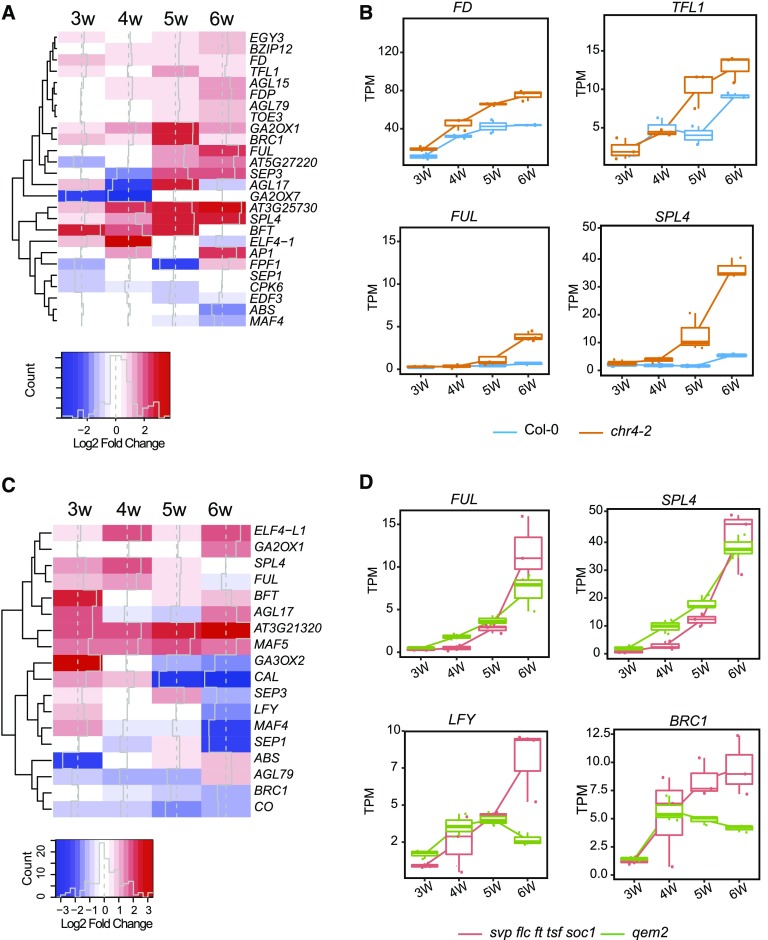
(A) Transcriptional profile comparisons represented as a heatmap to highlight genes implicated in flowering time control that are significantly upregulated (red) or downregulated (blue) in chr4-2 compared with wild type. Gene expression changes are represented as log2-fold change.
(B) Box plots from RNA-seq data showing FD, TFL1, FUL, and SPL4 transcript levels in apices of chr4-2 and Col-0 under SDs. The Y-axis shows TPM. The X-axis shows time of sampling as weeks after sowing. Whiskers represent distance from the lowest to the largest data point.
(C) Transcriptional profile comparisons represented as a heatmap to highlight genes implicated in flowering time control that are significantly upregulated (red) or downregulated (blue) in qem2 compared with svp flc ft tsf soc1.
(D) Box plots from RNA-seq data showing FUL, SPL4, LFY, and BRANCHED1 (BRC1) transcript levels shown as TPM in apices of qem2 and svp flc ft tsf soc1 under SDs. The Y-axis shows TPM. The X-axis shows time of sampling as weeks after sowing. Whiskers represent distance from the lowest to the largest data point.

