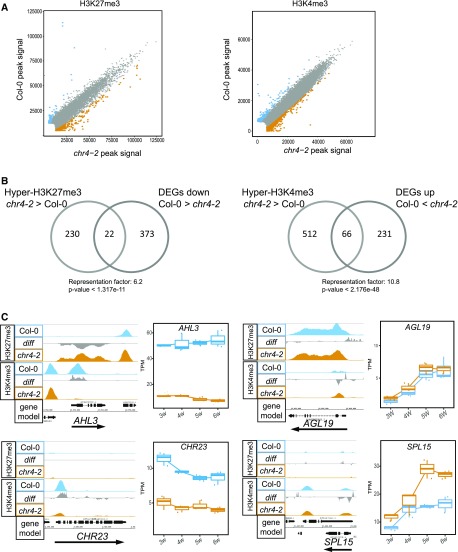
Figure 6.
Histone Modification Variation in chr4-2.
(A) Scatterplots showing H3K27me3 and H3K4me3 enrichment between Col-0 and chr4-2 in apices of 5-week–old plants grown under SDs. Blue and orange dots represent significantly more highly methylated regions at FDR = 0.05 in Col-0 and chr4-2, respectively.
(B) Venn diagram showing the overlap between DEGs and genes differentially marked by H3K27me3 and H3K4me3.
(C) H3K27me3 and H3K4me3 profiles and expression of AHL3, AGL19, CHR23, and SPL15.

