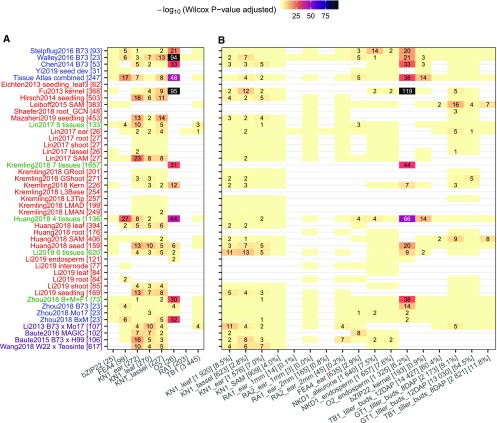
Figure 2.
TF-Target Interactions Predicted by GRNs Are Supported by Experimentally Derived TF Targets and Knockout Mutant RNA-Seq Experiments.
(A) Direct targets of published TF studies derived from ChIP-seq and mutant RNA-seq experiments.
(B) For each of the 17 maize TFs with knockout mutant RNA-seq data available, DEGs between the mutant and the wild type were identified using DESeq2 (P-value < 0.01). Wilcox rank tests were then performed using the predicted (TF-target) interaction scores (top 100k edges) between the group of true targets (DEGs) and nontargets (non_DEGs). P-values were adjusted by the Benjamini–Hochberg method implemented in R. Numbers in each cell show the adjusted test P-value (−log10 transformed). Supplemental Figure 2 provides the actual number of true targets captured by each GRN during each evaluation. Light yellow cells with no numbers indicate not significant (P > 0.05), while blank (white) cells indicate missing data where the TF being evaluated is not expressed or not variable (i.e., zero variance) in the corresponding GRN. The y axis labels correspond to the different networks listed in Figure 1. The x axis labels (e.g., KN1_ear (272) or KN1_ear [1576] [7.0%]) represent the common name for each TF, the tissue in which the TF is expressed, followed by the number of direct targets (A) or number and proportion of DEGs in TF mutant (B).

