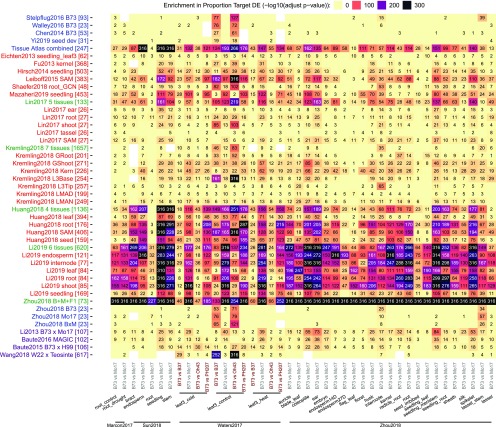
Figure 7.
Enrichment in Differentially Expressed Targets Regulated by TFs That Show SPE Patterns.
The color and number in each cell represent the enrichment P-value (−log10 transformed, Benjamini–Hochberg adjusted hypergeometric test P-value) of (SPE TF regulated) the proportion of the DE target relative to the genome-wide proportion of DEGs for each GRN (row-wise) evaluated against a tissue/treatment condition in a natural variation data set (column-wise). Only edges in the first bin (top 100k) of each network were taken.

