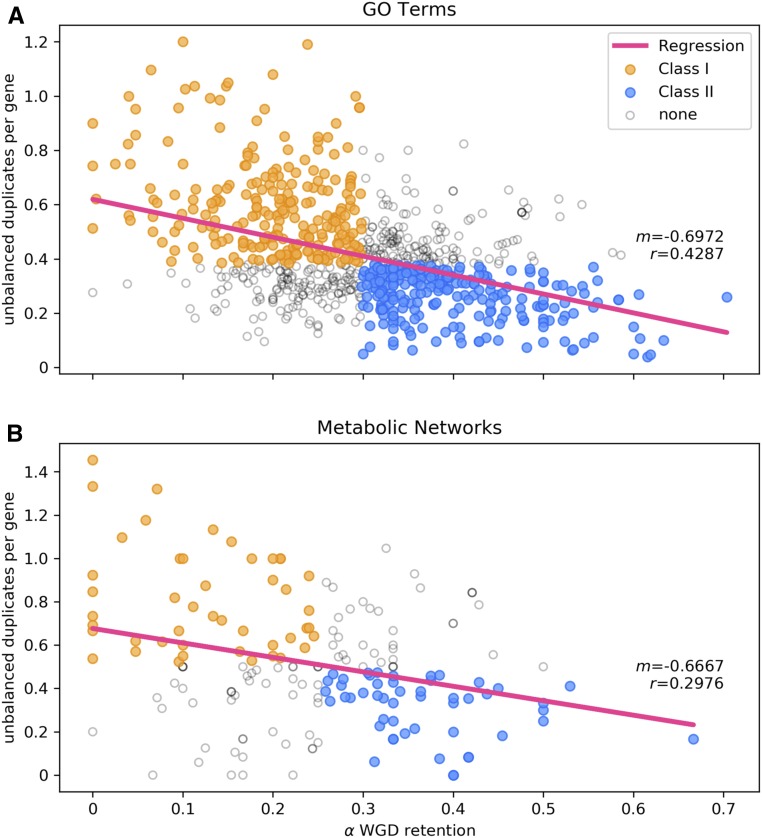
Figure 1.
Reciprocal Relationship between Small-Scale and Whole-Genome Duplications.
The number of unbalanced duplicates (duplicates produced by tandem, proximal, or TE-mediated duplication) per gene (y axis) versus fraction of genes retaining duplicates from the 𝛼 WGD (x axis) for GO classes and AraCyc metabolic pathways.
(A) GO.
(B) Metabolic pathways.
Yellow data points indicate gene groups assigned to class I (putatively dosage balance insensitive; higher-than-median numbers of unbalanced duplicates per gene and lower-than-median percentages of 𝛼 WGD retention), and blue data points indicate groups assigned to class II (putatively dosage balance sensitive; lower-than-median numbers of unbalanced duplicates per gene and higher-than-median percentages of 𝛼 WGD retention).

