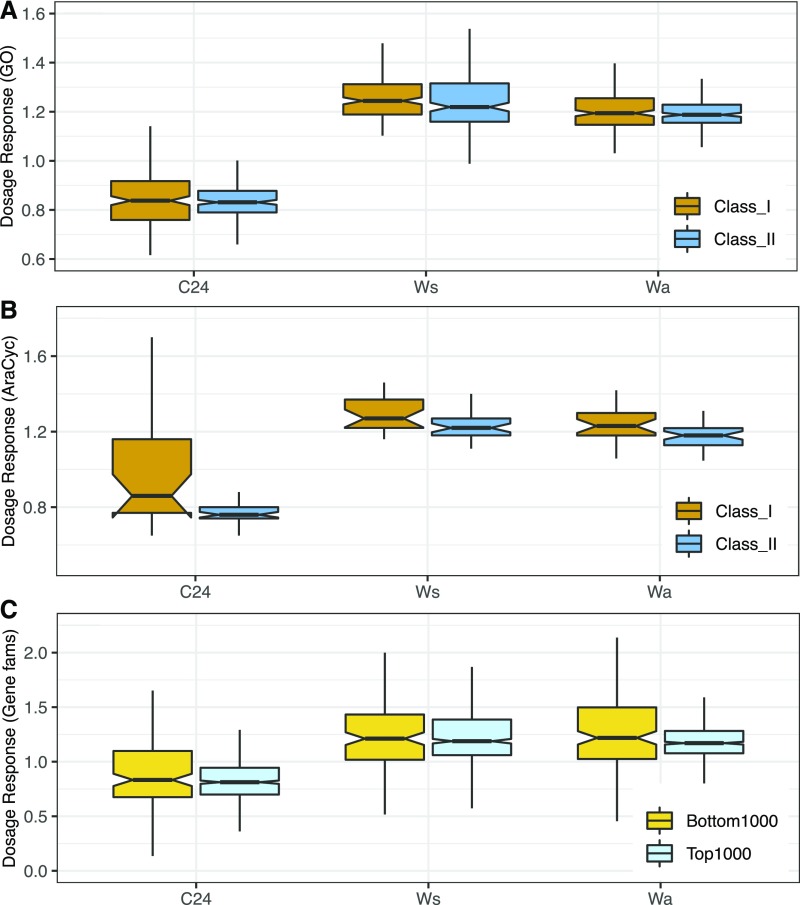
Figure 4.
Dosage Responses (Fold Change in Expression per Genome between Tetraploids and Diploids) by Dosage Sensitivity Class in C24, Ws, and Wa.
(A) GO terms.
(B) Metabolic networks.
(C) Reciprocal retention ranking of gene families (Tasdighian et al., 2017).

