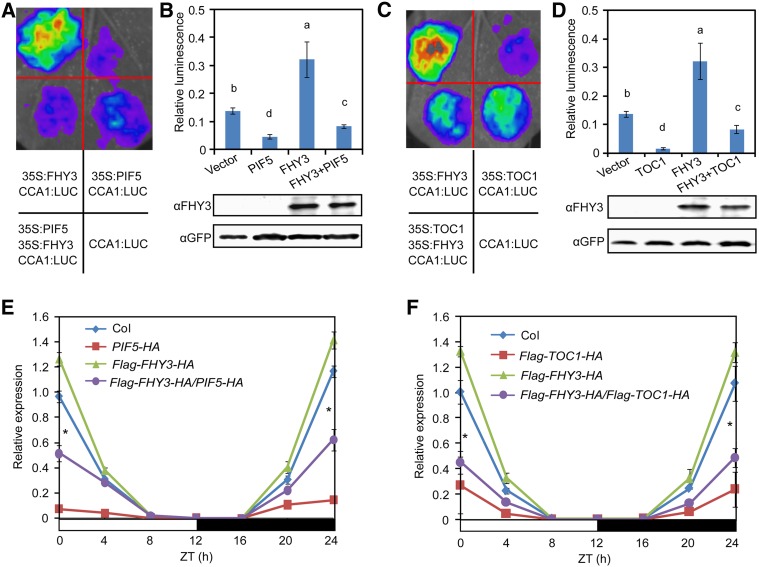
Figure 6.
TOC1 and PIF5 Repress the Transcriptional Activation Activity of FHY3 on CCA1 Expression.
(A) and (B) PIF5 suppresses the activation activity of FHY3 on CCA1 expression in N. benthamiana leaves. Relative LUC activity was normalized to REN activity (LUC/REN). Different letters indicate significant differences by one-way ANOVA with SAS software (P < 0.05). Values are means ± sd (n = 3 technical replicates). Three independent biological replicates showed similar results.
(C) and (D) TOC1 suppresses the activation activity of FHY3 on CCA1 expression in N. benthamiana leaves. Different letters indicate significant differences by one-way ANOVA with SAS software (P < 0.05). Values are means ± sd (n = 3 technical replicates). Three independent biological replicates showed similar results.
(E) CCA1 expression is reduced in 35S:Flag-FHY3-HA/35S:PIF5-HA seedlings compared with its parental line 35S:Flag-FHY3-HA.
(F) CCA1 expression is reduced in 35S:Flag-FHY3-HA/35S:Flag-TOC1-HA seedlings compared with its parental line 35S:Flag-FHY3-HA.
For (E) and (F), seedlings were grown at 22°C in 12L:12D conditions for 7 d before being harvested for RNA extraction (*, P < 0.05, Student’s t test). Values are means ± sd (n = 3 technical replicates). Two independent biological replicates showed similar results.

