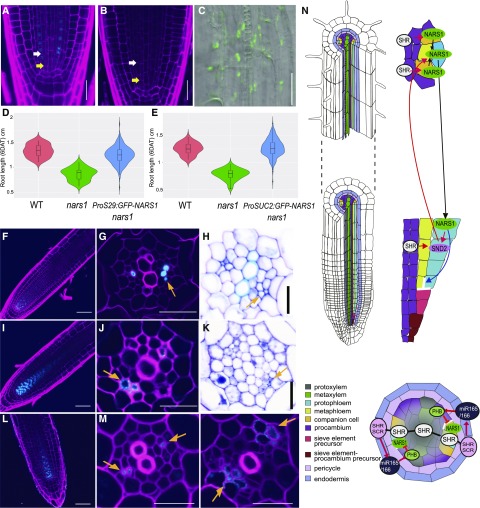
Figure 8.
Functional Analysis of NARS1 as a Potential Top-Down Signal for Asymmetric Cell Divisions of Sieve Element Precursors and a Proposed Molecular Model.
(A) to (C) Analysis of the division recovery of phloem SE precursors in the roots of ProS29:GFP-NARS1 nars1 (A) and ProSUC2:GFP-NARS1 nars1 ([B] and [C]).
(D) and (E) Analysis of the root length recovery process of ProS29:GFP-NARS1 nars1 [three independent homozygous T3 lines (n = 263), wild type (WT; n = 32) and nars1 (n = 50); (D)] and ProSUC2:GFP-NARS1 nars1 (three independent homozygous T3 lines [n = 256], WT [n = 35] and nars1 [n = 50]; [E]).
(F) to (H) Transgenic roots expressing ProCRE1:GFP-NARS1 Col-0.
(I) to (K) Transgenic roots expressing ProCRE1:SND2-GFP Col-0.
(L) and (M) Transgenic roots expressing ProCRE1:GFP-NARS1 shr-2. Longitudinal views of the root meristem expressing GFP-NARS1 (F, L) and SND2-GFP (I) are shown.
(G), (J), and (M) SE-ENOD immunolocalization.
(H) and (K) Toluidine blue staining.
(N) Proposed model of phloem development initiated by SHR in Arabidopsis roots. The regulatory scheme shown on the longitudinal axis illustrates the positive feedforward regulatory loop composed of SHR, NARS1, and SND2 and the positive feedback regulation between NARS1 and SND2. In the cross section, the repression of NARS1 by PHB is shown. Red arrow, gene regulation; black arrow, intercellular movement. In (A) and (B), yellow arrows indicate the ACDs of procambium-phloem SE precursors, and white arrows indicate the ACDs of phloem SE precursors. Orange arrows in (G), (H), (J), (K), and (M) indicate ectopic phloem SEs. Scale bar = 20 μm.

