Figure 2.
REPP12 Encodes ALA3, a Phospholipid Flippase.
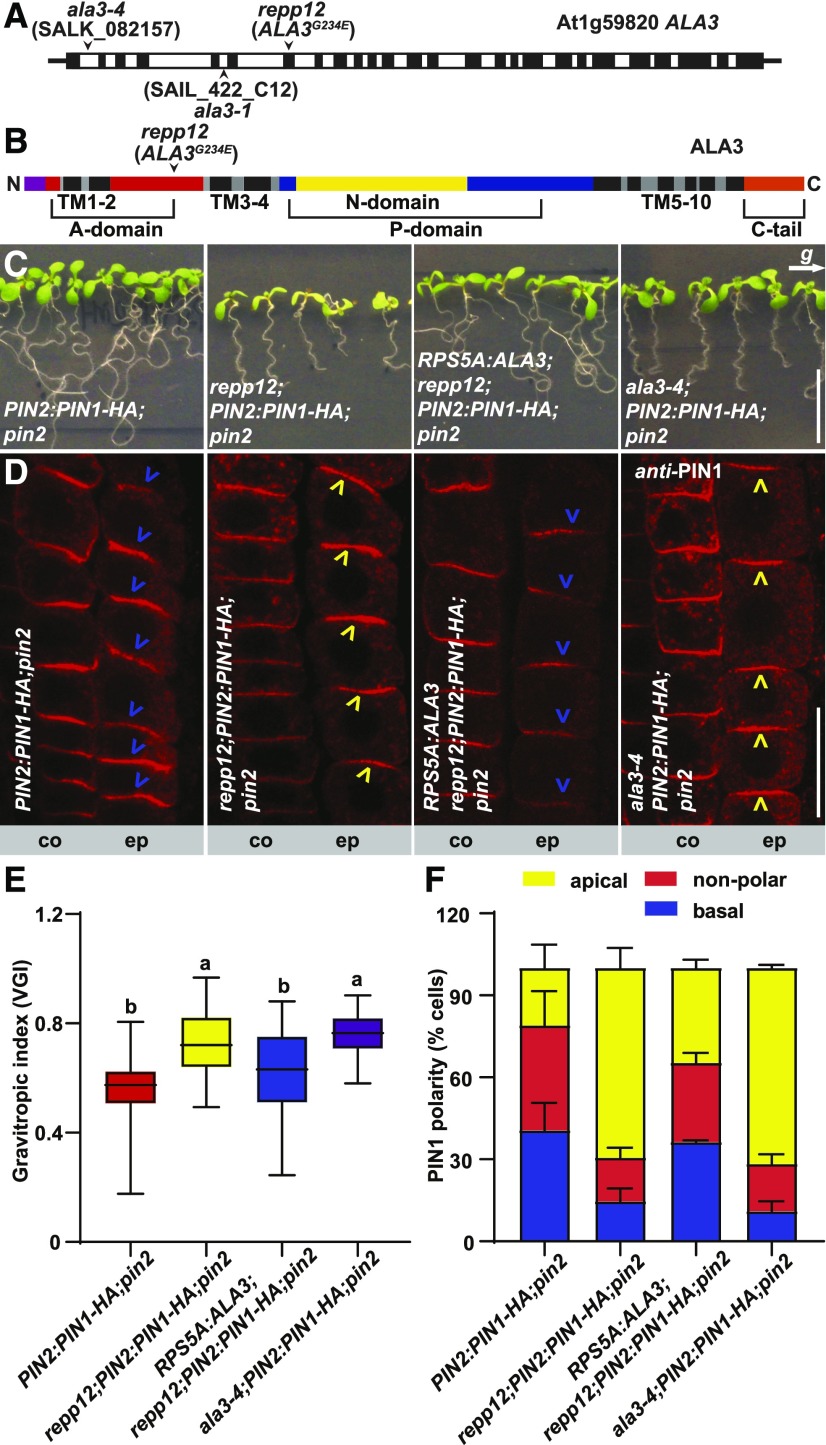
(A) Gene model of ALA3 (At1g59820). Black boxes and white boxes represent exons and introns, respectively. Mutation site of repp12 and T-DNA insertion positions of ala3-1 and ala3-4 are indicated.
(B) Schematic diagram of ALA3. The red boxes represent the Actuator (A) domain; the yellow box represents the Nucleotide binding (N) domain; the blue boxes represent the Phosphorylation (P) domain; the black boxes represent transmembrane helixes; the purple box represents the cytoplasmic N-tail; the orange box represents cytoplasmic C-tail. The repp12 (ALA3G234E) mutation is located on the A-domain.
(C) Root gravitropic analysis of PIN2:PIN1-HA;pin2, repp12;PIN2:PIN1-HA;pin2, RPS5A:ALA3;repp12;PIN2:PIN1-HA;pin2, and ala3-4;PIN2:PIN1-HA;pin2 seedlings after 16-h gravistimulation. The letter g indicates the direction of the gravity vector. Scale bar = 10 mm.
(D) Immunolocalization of PIN1-HA with PIN1 antibody in the root cortex (co) and epidermal cells (ep) of PIN2:PIN1-HA;pin2, repp12;PIN2:PIN1-HA;pin2, RPS5A:ALA3;repp12;PIN2:PIN1-HA;pin2, and ala3-4;PIN2:PIN1-HA;pin2 seedlings. Blue and yellow arrowheads indicate basally and apically localized PIN1-HA in root epidermal cells, respectively. Scale bar = 20 μm.
(E) Box plot showing the root gravitropic index for PIN2:PIN1-HA;pin2 (n = 38), repp12;PIN2:PIN1-HA;pin2 (n = 32), RPS5A:ALA3;repp12;PIN2:PIN1-HA;pin2 (n = 55), and ala3-4;PIN2:PIN1-HA;pin2 (n = 38). For the box plot, the box defines the first and third quartiles, and the central line in the box represents the median. Whiskers, from minimum to maximum. Different letters represent significant differences at P < 0.05 by one-way ANOVA with a Tukey multiple comparisons test. The experiment was repeated at least three times with similar results.
(F) Stacked bars showing the percentage of the apical, nonpolar, or basal PIN1-HA localization in root epidermal cells of PIN2:PIN1-HA;pin2, repp12;PIN2:PIN1-HA;pin2, RPS5A:ALA3;repp12;PIN2:PIN1-HA;pin2 and ala3-4;PIN2:PIN1-HA;pin2 seedlings. For each genotype, >200 root epidermal cells from >20 roots were analyzed per experiment. Error bars represent sd from three biologically independent experiments.

