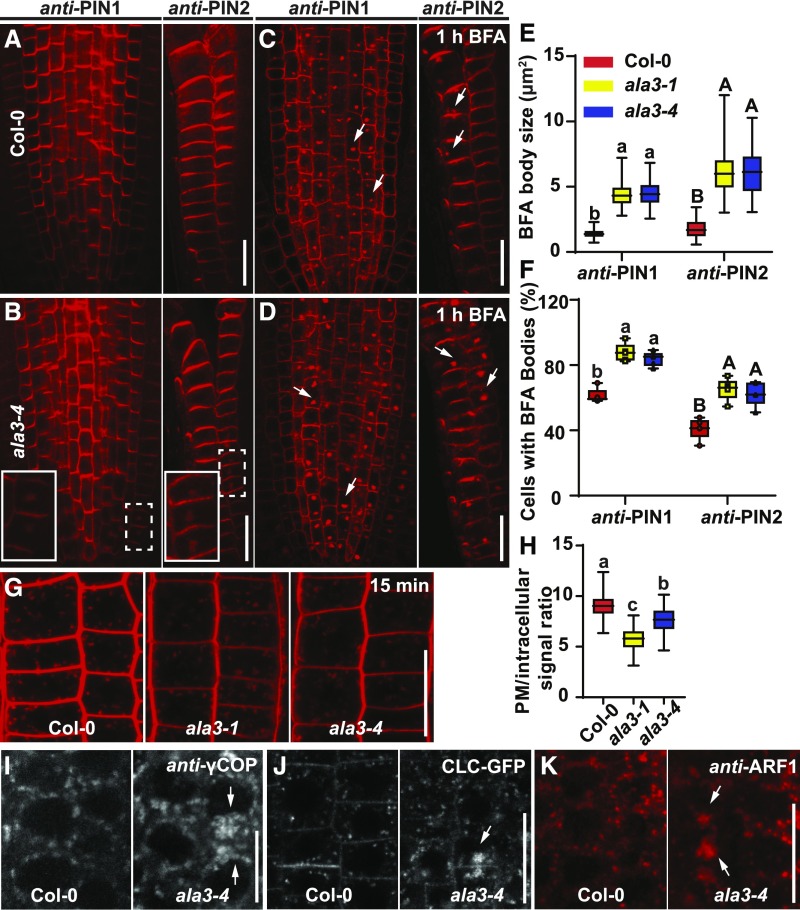
Figure 4.
The Trafficking Defects in ala3 Mutants.
(A) to (D) Immunolocalization of PIN1 and PIN2 in 4-d–old roots of Col-0 and ala3-4 seedlings treated with DMSO (A) and (B) and 50 μM of BFA for 1 h (C) and (D). Aggregations were observed in the indicated cells (by the dashed line rectangle), which were magnified (full line rectangle). White arrows indicate PIN1- and PIN2-labeled BFA bodies. Scale bar = 20 μm.
(E) Quantification of BFA body size. Eighty BFA bodies from five roots per genotype were measured. For the box plot, the box defines the first and third quartiles, and the central line in the box represents the median. Whiskers, from minimum to maximum. Different letters represent significant differences at P < 0.05 by one-way ANOVA with a Tukey multiple comparisons test. The experiment was repeated three times with similar results.
(F) Quantification of the percentage of cells with BFA bodies per root. Five roots per genotype were evaluated. For the box plot, the box defines the first and third quartiles, and the central line in the box represents the median. Whiskers, from minimum to maximum showing all points. Different letters represent significant differences at P < 0.05 by one-way ANOVA with a Tukey multiple comparisons test. The experiment was repeated three times with similar results.
(G) Two micromoles of FM4-64 staining of Col-0, ala3-1, and ala3-4 seedlings for 15 min. Scale bar = 20 μm.
(H) Quantification of FM4-64 internalization (PM/intracellular signal). More than 40 cells from 10 roots were measured. For the box plot, the box defines the first and third quartiles, and the central line in the box represents the median. Whiskers, from minimum to maximum. Different letters represent significant differences at P < 0.05 by one-way ANOVA with a Tukey multiple comparisons test. The experiment was repeated at least three times with similar results.
(I) Immunolocalization of Golgi marker γCOP in Col-0 and ala3-4. White arrows indicate the aggregations of γCOP in ala3-4. Frequencies of cells with aggregations: Col-0 (0% ± 0%) and ala3-4 (2.4% ± 0.8%). Values represent means ± sd. For each genotype, >10 single-scanned images were collected and analyzed per experiment. Two biologically independent experiments were done with similar results. Scale bar = 10 μm.
(J) CLC-GFP in Col-0 wild type and ala3-4 roots. Aggregations were observed in ala3-4. Frequencies of cells with aggregations: Col-0 (0% ± 0%) and ala3-4 (2% ± 0.88%). Values are means ± sd. For each genotype, six single-scanned images were collected and analyzed per experiment. White arrows indicate the aggregations. Three biologically independent experiments were done with similar results. Scale bar = 20 μm.
(K) Immunolocalization of ARF1 in Col-0 and ala3-4 roots. Aggregations were observed in ala3-4. Frequencies of cells with aggregations: Col-0 (0% ± 0%) and ala3-4 (2.9% ± 0.92%). Values represent means ± sd. For each genotype, nine single-scanned images per experiment were collected and analyzed. White arrows indicate the aggregations of ARF1 in ala3-4. Three biologically independent experiments were performed with similar results. Scale bar = 20 μm.

