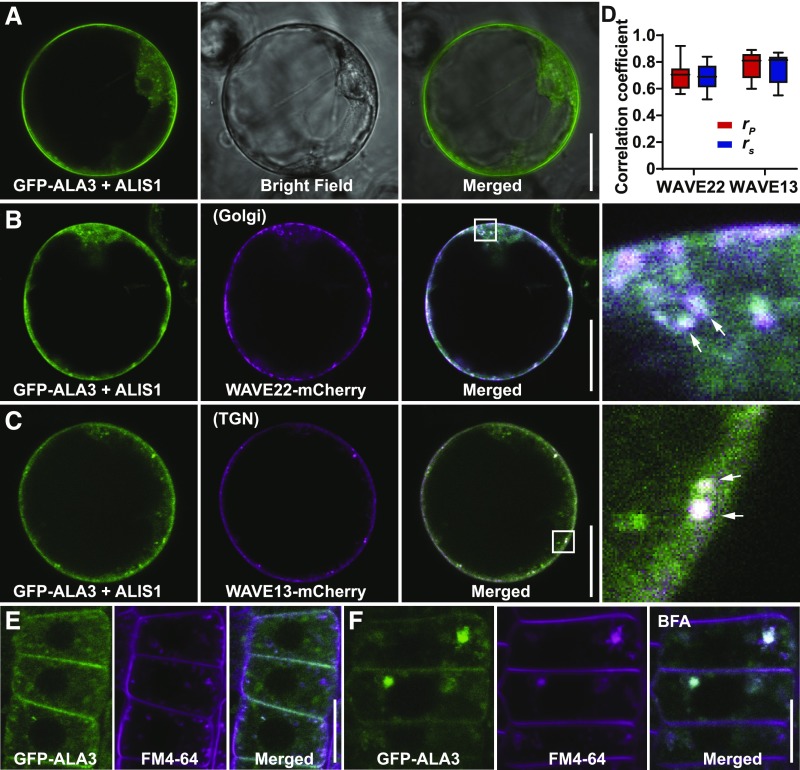
Figure 5.
Subcellular Localization of ALA3 to the PM, Golgi, and TGN.
(A) Transient co-expression of GFP-ALA3 and untagged ALIS1 in protoplasts. PM and endomembrane compartment signals were observed. Scale bar = 20 μm.
(B) and (C) Transient co-expression of GFP-ALA3, untagged ALIS1 with the Golgi marker WAVE22-mCherry (B) or TGN marker WAVE13-mCherry (C) in protoplasts. The right representations for (B) and (C) were enlarged from the regions highlighted by the white boxes in the merged representations. The arrows in the right panels for (B) and (C) indicate the colocalization of GFP-ALA3 with WAVE22-mCherry (B) and WAVE13-mCherry (C), respectively. Scale bars = 20 μm.
(D) Evaluation of the colocalization of GFP-ALA3 with Golgi marker WAVE22-mCherry and TGN marker WAVE13-mCherry when co-expressed with untagged ALIS1 in protoplasts. The Pearson correlation coefficient (rP) and Spearman correlation coefficient (rS) were calculated after analysis with 24 manually selected regions of interest from 12 individual protoplast cells. The values of rP and rS range from +1 (perfect correlation) to −1 (negative correlation). Error bars represent sd. The experiment was repeated three times with similar results.
(E) The colocalization of GFP-ALA3 and FM4-64. After induction with 10 μM of β-estradiol for 12 h, 4-d–old XVE:GFP-ALA3;repp12 seedlings were stained with 2 μM of FM4-64 for 15 min. Scale bar = 20 μm.
(F) Representative images of BFA body formation of GFP-ALA3 and FM4-64. After 10 μM of β-estradiol induction for 12 h, 4-d–old XVE:GFP-ALA3;repp12 seedlings were stained with 2 μM of FM4-64 and treated with 50 μM of BFA for 1 h. Scale bar = 20 μm.

