Figure 7.
Genetic Interactions between ALA3 and ARF GEFs.
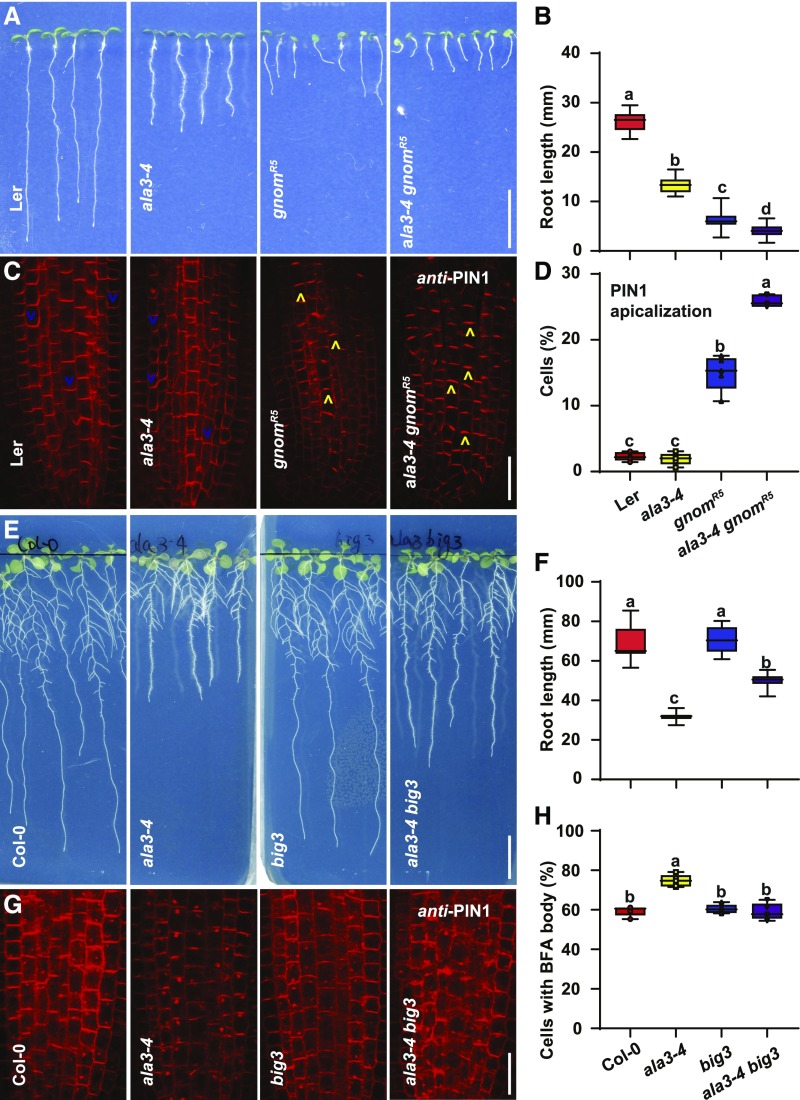
(A) Root phenotypes of 7-d–old Ler, ala3-4, gnomR5, and ala3-4 gnomR5seedlings. Ler (control) and gnomR5 seedlings were obtained from the segregating population of heterozygous gnomR5 (+/−). ala3-4 and ala3-4 gnomR5 seedlings were from the segregating population of heterozygous ala3-4 (−/−) gnomR5 (+/−). Scale bar = 10 mm.
(B) Box plot showing the root length for the seedlings as in (A), n > 15 seedlings. For the box plot, the box defines the first and third quartiles, and the central line in the box represents the median. Whiskers, from minimum to maximum. Different letters represent significant differences at P < 0.05 by one-way ANOVA with a Tukey multiple comparisons test. The experiment was repeated three times with similar results.
(C) Immunolocalization of PIN1 in Ler, ala3-4, gnomR5, and ala3-4 gnomR5. Blue and yellow arrowheads, respectively, indicate basally and apically localized PIN1. Scale bar = 20 μm.
(D) Box plot with individual data points showing the percentage of apically localized PIN1 in roots of Ler, ala3-4, gnomR5, and ala3-4 gnomR5 (n = 5 roots). For the box plot, the box defines the first and third quartiles, and the central line in the box represents the median. Whiskers, from minimum to maximum showing all points. Different letters represent significant differences at P < 0.05 by one-way ANOVA with a Tukey multiple comparisons test. The experiment was repeated three times with similar results.
(E) Twelve-d–old Col-0, ala3-4, big3, and ala3-4 big3 seedlings. Scale bar = 10 mm.
(F) Box plot showing the root length of seedlings shown in (E), n > 11 seedlings. big3 partially rescues the root growth phenotype of ala3-4. For the box plot, the box defines the first and third quartiles, and the central line in the box represents the median. Whiskers, from minimum to maximum. Different letters represent significant differences at P < 0.05 by one-way ANOVA with a Tukey multiple comparisons test. The experiment was repeated three times with similar results.
(G) Immunolocalization of PIN1 in Col-0, ala3-4, big3, and ala3-4 big3 seedlings treated with 50 μM of BFA for 1 h. Scale bar = 20 μm.
(H) Box plot with individual data points showing the percentage of root stele cells with PIN1-labeled BFA bodies (n = 5 roots). For the box plot, the box defines the first and third quartiles, and the central line in the box represents the median. Whiskers, from minimum to maximum showing all points. Different letters represent significant differences at P < 0.05 by one-way ANOVA with a Tukey multiple comparisons test. The experiment was repeated three times with similar results.

