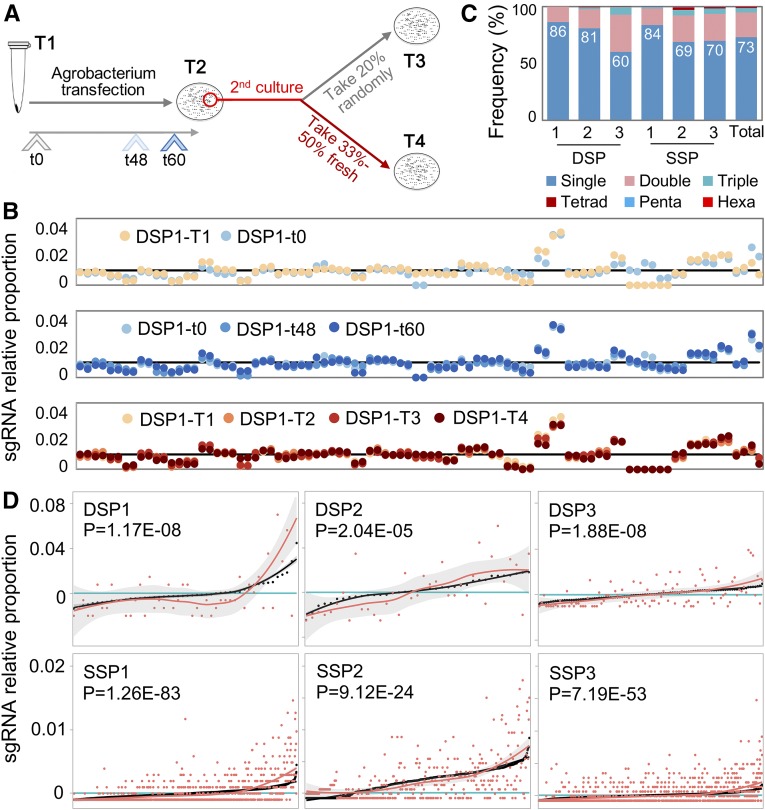
Figure 2.
High Coverage and Uniformity from Plasmid Pool to T0 Individuals.
(A) and (B) Plasmid sequencing in quality-control process (A), results of measuring the coverage and uniformity of sgRNA amount (B). T1, Primary plasmid pool before Agrobacterium transfection, at t0. T2, Plasmid pool extracted from the first Agrobacterium colonies. T3, Plasmid pool randomly extracted from 20% of colonies of second Agrobacterium transfections. T4, Plasmid pool specifically taken from 33 to 50% of fresh and more vigorous colonies of second Agrobacterium transfection for further embryo transformation. t0, The primary plasmid pool before Agrobacterium transfection; t48/t60, 48 h or 60 h culture on solid medium after Agrobacterium transfection. The sgRNAs are ordered along the x axis based on their ID number. The "DSP1-T1" and "DSP1-t0" in the top panel here were equivalent to technical repeats.
(C) Ratio of coinfection events in six batches (three SSPs and three DSPs) and total.
(D) Correlation of sgRNA relative amount between plasmid pool (black) and T0 individuals (red). Proportion lines were smoothed. All sgRNAs along the x axis were sorted according to their relative proportion in the plasmid pool.

