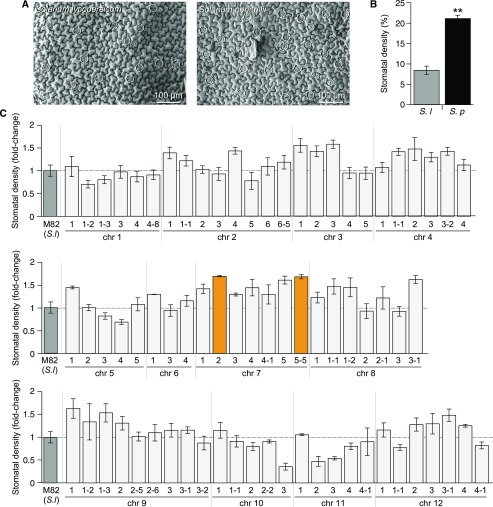
Figure 2.
Stomatal Density of the S. lycopersicum cv M82 × S. pennellii ac. LA716 ILs.
(A) SEMs of the adaxial epidermis of a fully expanded leaf of S. lycopersicum (cv M82; left) and S. pennellii (ac. LA716; right). White circles indicate stomatal locations.
(B) Stomatal density of the first fully expanded true leaf of S. lycopersicum cv M82 (gray bar) and S. pennellii ac. LA716 (black bar). Values are expressed as mean ± se (n = 3). Stars indicate significant differences (P-value < 0.01) according to a t test.
(C) Stomatal density of the first generation of ILs, grouped according to the chromosomal location of the introgressed S. pennellii genomic region. Values show the mean ± se (n = 3 to 4) of the relative value of stomatal density compared with M82 values (medium gray bars). Significant differences were determined using the Dunnett’s test. Orange bars indicate ILs with a significantly higher stomatal density than M82 (P-value < 0.05). Light gray bars indicate any other ILs.

