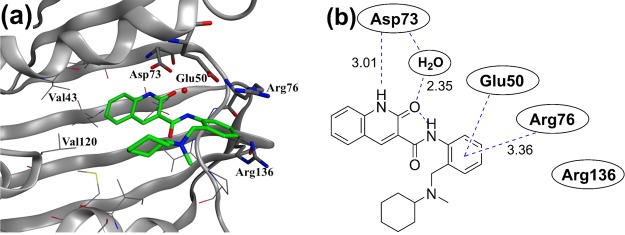
Figure 4.
X-ray structure analysis of HTS hit 1 in the ATPase domain of E. coli GyrB. (a) X-ray crystal structure of 1 in E. coli GyrB (residues 1–220, PDB code: 6KZV). Residues involved in key interactions (Asp73, Glu50, Arg76, and Arg136; E. coli GyrB numbering) are represented in a stick format. A conserved water molecule is displayed as a red ball. (b) Identical view on the two-dimensional (2D) plot showing the relevant interactions, indicated with dashed lines, and the distances are given in Angstrom units.

