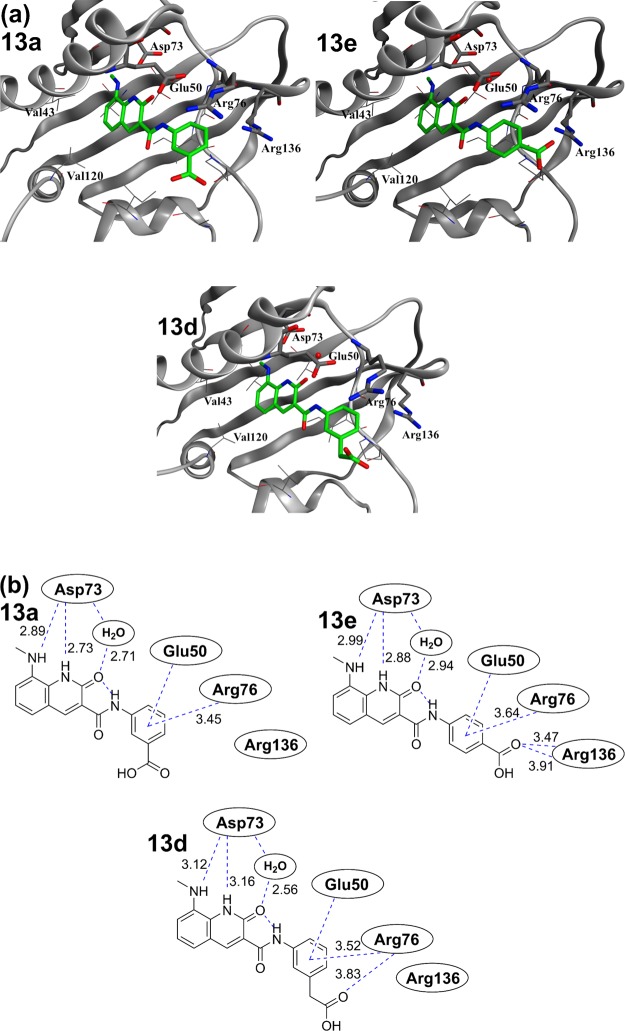
Figure 9.
Comparison of the binding modes of compounds 13a, 13e, and 13d. (a) X-ray crystal structures of 13a, 13e, and 13d in E. coli GyrB (residues 1–220, PDB code: 6KZX, 6KZZ, and 6L01). Residues involved in key interactions (Asp73, Glu50, Arg76, and Arg136) are represented in stick format. The conserved water molecules are displayed as red balls. (b) Identical view on the 2D plot showing relevant interactions, indicated with dashed lines; the distances are given in Angstrom units.

