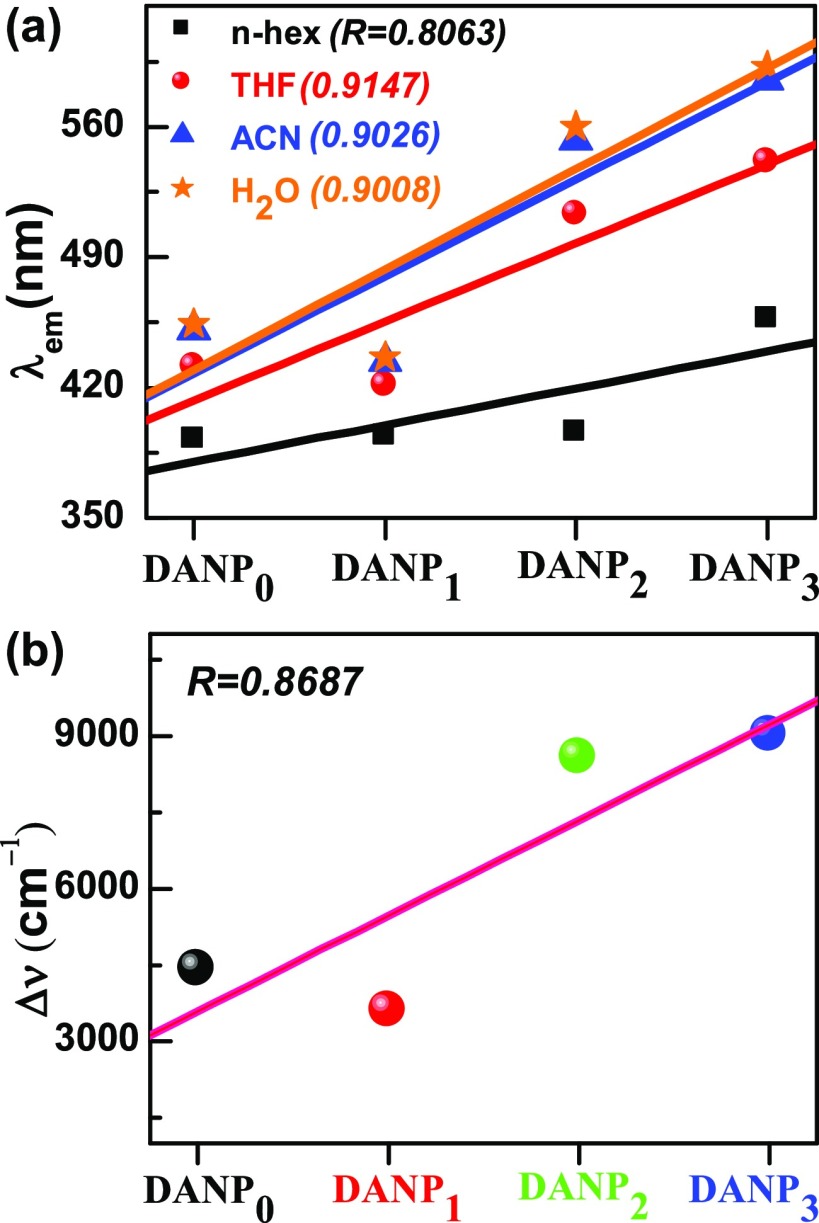
Figure 6.
(a) Plot of the fluorescence band position in different solvents against ICT molecules of different donor–acceptor distances. (b) Stokes’ shift in the ACN solvent vs ICT molecules of different donor–acceptor distances. The donor–acceptor distance here is represented by the number of the C=C–C moiety within the chromophore and acceptor.

