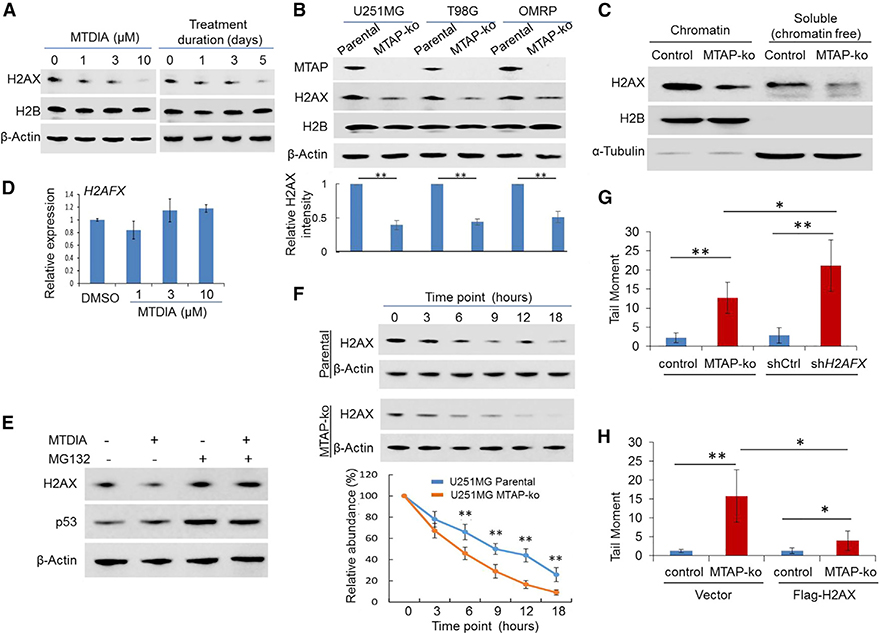
Figure 2. Loss of MTAP Function Compromises H2AX Proteostasis in GBM Cells.
(A) U251MG cells were treated with different doses of MTDIA for 24 h or treated with MTDIA (3 μM) for indicated time points, and immunoblots were performed to determine the abundance of H2AX (H2B protein level remained unchanged, serving as an additional control).
(B) The abundance of H2AX was examined in parental GBM cell lines, a transformed human astrocyte cell line (OMRP), and their matched MTAP-ko derivatives.An anti-MTAP immunoblot confirmed the loss of MTAP in the MTAP-ko cell line, and an anti-H2B immunoblot served as an additional control for loading. The quantification of the relative abundance of H2AX in each lane is shown in the bottom panel.
(C) U251MG cells were used for chromatin fractionation, and both chromatin-associated and chromatin-free fractions were used for immunoblots (note thespecific and clean immunoblot signaling; the slightly different migration of proteins between the two fractions was most likely due to a difference in buffers).
(D) qRT-PCR determined the level of the H2AFX transcript in U251MG cells following MTDIA treatment for 24 h.
(E) U251MG cells were exposed to DMSO or MTDIA (3 μM), without or with MG132 (10 μM), for 24 h, and immunoblotting was performed to determine the abundance of H2AX (an anti-p53 immunoblot served as an additional control confirming the effect of MG132).
(F) Parental U251MG or its MTAP-ko derivative line was treated with cycloheximide for indicated time points, and the abundance of H2AX was determined by immunoblotting (quantification of relative H2AX abundance compared to the starting time point is shown in the bottom panel).
(G) U251MG cell line knockdown control (shCtrl) or H2AFX knockdown (shH2AFX) were used for alkaline comet assays, and quantification of the tail moment is shown (representative images of the comet assay are shown in Figure S3B).
(H) U251MG cell lines (CRISPR control or MTAP-ko), without or with overexpression of exogenous H2AX, were used for alkaline comet assays, and quantification of the tail moment is shown (representative images of the alkaline comet assay are shown in Figure S3D).
Student’s t-test was used for statistical analysis, except for (G) and (H), where Mann-Whitney U test was used. *p < 0.05, **p < 0.01. Error bars represent mean ± SD.

