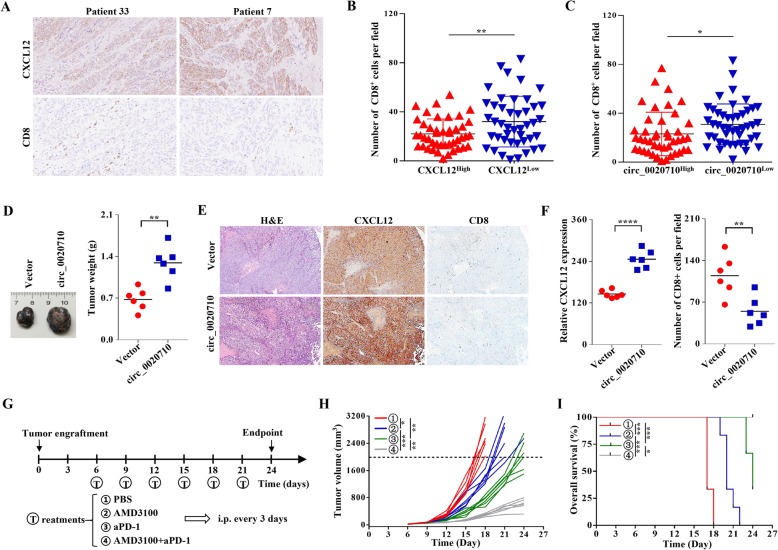
Fig. 7.
circ_0020710 is correlated with CTL exclusion. a IHC assay was used to detect the CTL number. b Number of CTL in different melanoma samples according to the expression of CXCL12. c Number of CTL in different melanoma samples according to the expression of circ_0020710. e Photographs illustrated tumors in xenografts. f IHC analysis was used to detect CTL numbers and CXLC12 expression. g Schematic representation of xenograft tumor model. h Growth curve of subcutaneous B16F10-circ_0020710 cells with different treatments. i Survival curve of part h. Unpaired student’s t-test, Mann-Whitney U test and one-way ANOVA test were used for the statistical analyses. *p < 0.05; **p < 0.01; ****p < 0.0001; ns, no significant

