Figure 5.
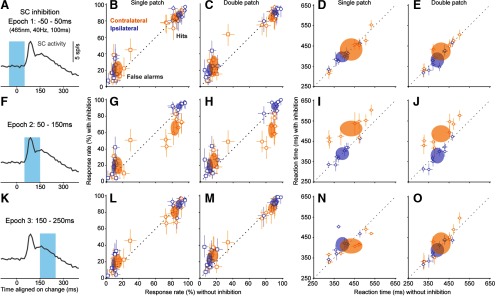
The effect of SC inhibition on detection performance and reaction times had remarkable temporal specificity. A, For epoch 1, optogenetic inhibition of the SC (465 nm, 40 Hz) was applied from −50 to 50 ms with respect to the orientation change. SC activity trace is the same data as shown in Fig. 4C. B, Single-patch trial hit rates (circles) and false alarm rates (squares) versus without SC inhibition applied during epoch 1 for eight mice, plotted separately for contralateral (orange) and ipsilateral (blue) blocks. Open symbols are mean response rates from individual mice; error bars are 95% CIs. Ellipses are 95% CIs of the population mean. C, Same as B, but for double-patch trials. D, Reaction times versus without SC inhibition during epoch 1 for single-patch trials. E, Reaction times versus without SC inhibition during epoch 1 for double-patch trials. F, For epoch 2, optogenetic inhibition of the SC was applied from 50 to 150 ms with respect to the orientation change. G, Same as B, except that SC inhibition was applied during epoch 2. H, Same as G, but for double-patch trials. I, Reaction times versus without SC inhibition during epoch 2 for single-patch trials. J, Reaction times versus without SC inhibition during epoch 2 for double-patch trials. K, For epoch 3, optogenetic inhibition of the SC was applied from 150 to 250 ms with respect to the orientation change. L, Same as B, except that SC inhibition was applied during epoch 3. M, Same as L, but for double-patch trials. N, Reaction times versus without SC inhibition during epoch 3 for single-patch trials. O, Reaction times versus without SC inhibition during epoch 3 for double-patch trials. Overall, changes in hit rates and reaction times were only evident with SC inhibition when applied during epoch 2 for contralateral orientation changes.

