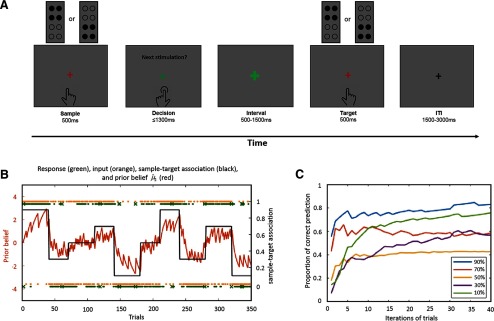
Figure 1.
Experimental design and participants' behavioral performance. A, Experimental design. Participants were instructed to predict the target stimulus as accurately as possible based on the predictability of the sample stimulus. Both sample and target stimuli were delivered to the dominant (right) hand. B, The sample-target association and a subject-specific example of prior belief (). Black line, Time-varying sample-target association strengths consisting of strongly predictive (90% and 10%), moderately predictive (70% and 30%), and nonpredictive (50%) blocks; red line, example of a subject-specific trajectory of prior beliefs about sample-target contingencies; orange dots, trial outcomes (or tactile inputs); green dots, participant's observed responses; green cross, participant's missing responses. C, The proportion of expected targets (Correct) over time for each of the five sample-target contingencies (i.e., 90%, 70%, 50%, 30%, and 10%). The colored lines show the difference in proportion of Correct trials between blocks with high predictability and low predictability indicating successful learning of sample-target contingencies.

