Figure 2.
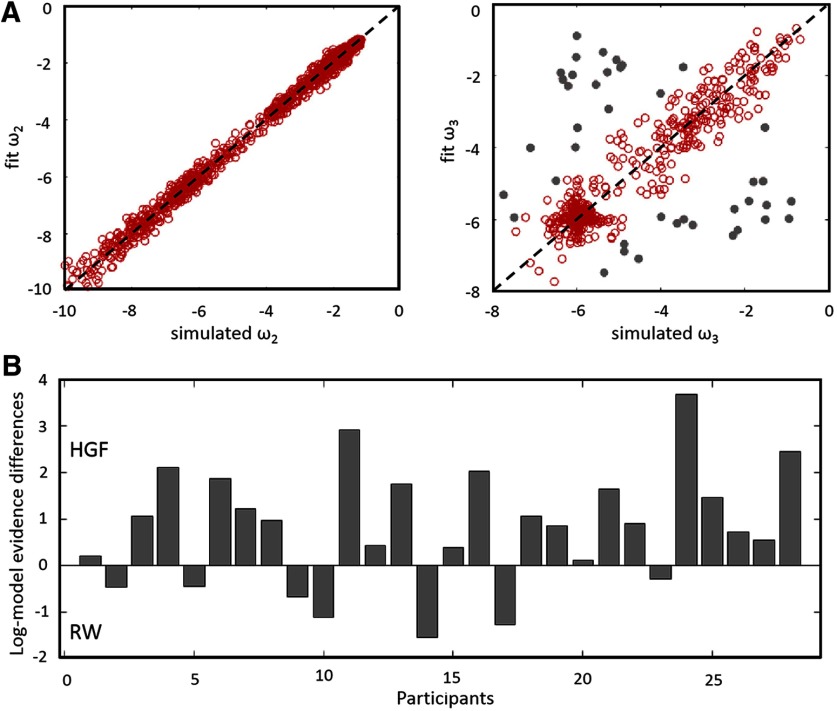
Parameter recovery for the HGF model and differences in log-model evidence for the HGF model as compared to the RW model. A, Parameter recovery for the HGF model. Grey dots correspond to points where parameter recovery for ω3 is bad (i.e., when |ωsim − ωfit |>1). As shown in the figure, there is fairly good correlation between the simulated and fitting parameter values, which indicates that the parameter values can be recovered with good precision using the HGF model. B, Individual difference of log-model evidence between the HGF model and the RW model. Positive values index participants who presented higher model evidence for the HGF model.

