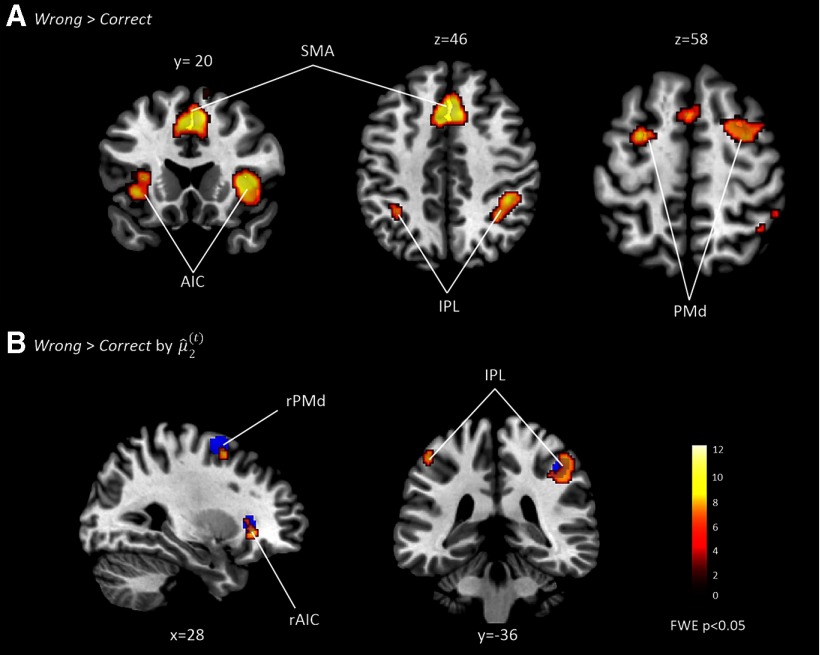
Figure 3.
Results of the GLM analysis. A, Bilateral brain regions that were activated by Wrong > Correct. B, Regions related to prior belief for unexpected trials as revealed by a t-contrast Wrong > Correct by the modulatory parameters (). The blue pattern represents activations revealed by comparing Wrong > Correct, as shown in A. Note that only regions in the right hemisphere significantly overlapped in both contrasts, as follows: Wrong > Correct by the modulatory parameters () and Wrong > Correct. Since our DCM models were based on both contrasts, we only considered the three regions in the right hemisphere for DCM, but not left IPL. Significant activations (p < 0.05, FWE corrected) were superimposed on sagittal, coronal, and axial slices of a standard T1-weighted image, as implemented in SPM. Coordinates next to each slice index their location in MNI space. Red-yellow coding indexes the t scores of activation intensities.

